Top 18 site speed tools (to test your website)


Website speed is a key driver of online business success. According to Google, 53% of users will abandon your site if it takes more than 3 seconds to load. Even a single extra second can slash your conversion rate by up to 20%! Wild.
The impact of speed is even more noticeable on mobile sites. Over half of global Internet traffic already originates from smartphones. Mobile users expect websites to load just as quickly as they do on desktops. Plus, speed isn’t just about convenience; it’s a vital ranking factor for search engines. Google and others weigh Core Web Vitals heavily when determining a site’s ranking.
A slow website isn’t just frustrating for users, it can lead to direct financial losses, harm your reputation, and hurt your SEO rankings. That’s why it’s important to regularly test your site’s speed and leverage the right tools to pinpoint areas for improvement.
So, here are the 18 top services for checking website speed and getting detailed data to help you optimize your site.
Google PageSpeed Insights

Site: https://pagespeed.web.dev/
Google PageSpeed Insights (PSI) is an official tool for analyzing website loading speed. What sets it apart is its dual approach. They combine lab data from the Lighthouse engine with real user statistics from the Chrome User Experience Report. This means PSI reflects the actual user experience of Google users.
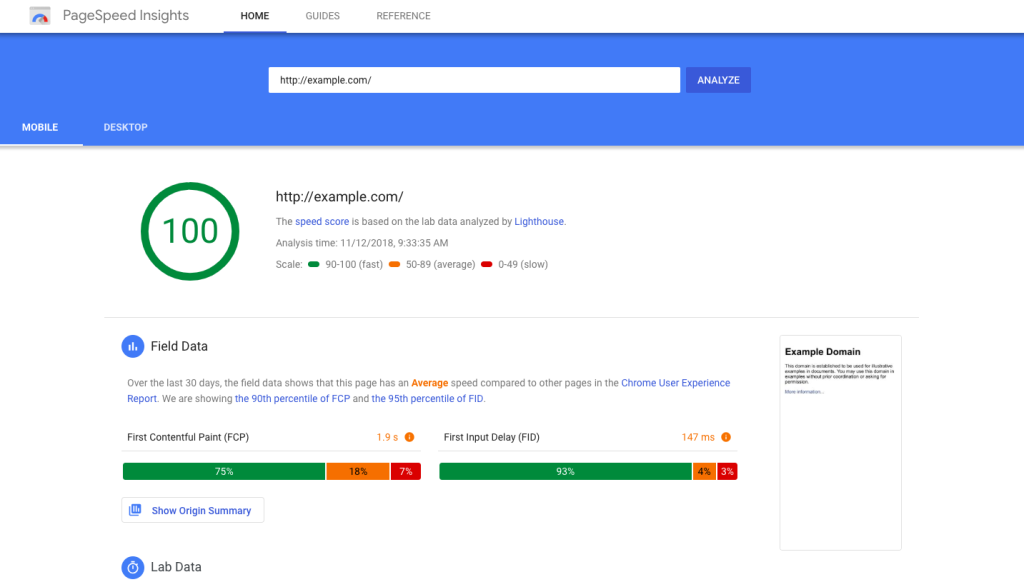
One of the standout features of this tool is its focus on Core Web Vitals, the metrics Google uses to rank websites. These include:
- LCP (Largest Contentful Paint), which measures how quickly the main content of a page is displayed.
- INP (Interaction to Next Paint), а responsiveness metric that replaces FID (First Input Delay).
- CLS (Cumulative Layout Shift), which assesses the stability of the visual layout, indicating how much the elements “jump” during loading.
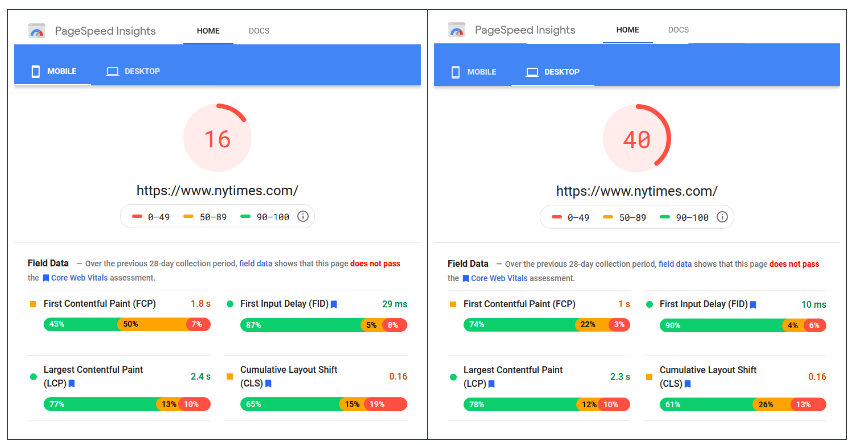
PSI displays results separately for mobile and desktop devices, which is especially important in the era of mobile-first indexing. In the reports, the user sees a detailed breakdown for each metric: a rating (good, needs improvement, or poor), specific numbers, and optimization recommendations.
For instance, the service can suggest reducing the size of images or converting them to WebP/AVIF format, postponing the loading of third-party scripts, or minifying CSS and JavaScript.
For developers, the integration of PageSpeed Insights with Chrome DevTools and API is a game-changer. You can automate checks in CI/CD processes and receive performance reports without manual testing.
The tool also highlights issues affecting user experience beyond just loading speed. A site might load quickly, but if elements jump or buttons are unresponsive, the rating will still suffer.
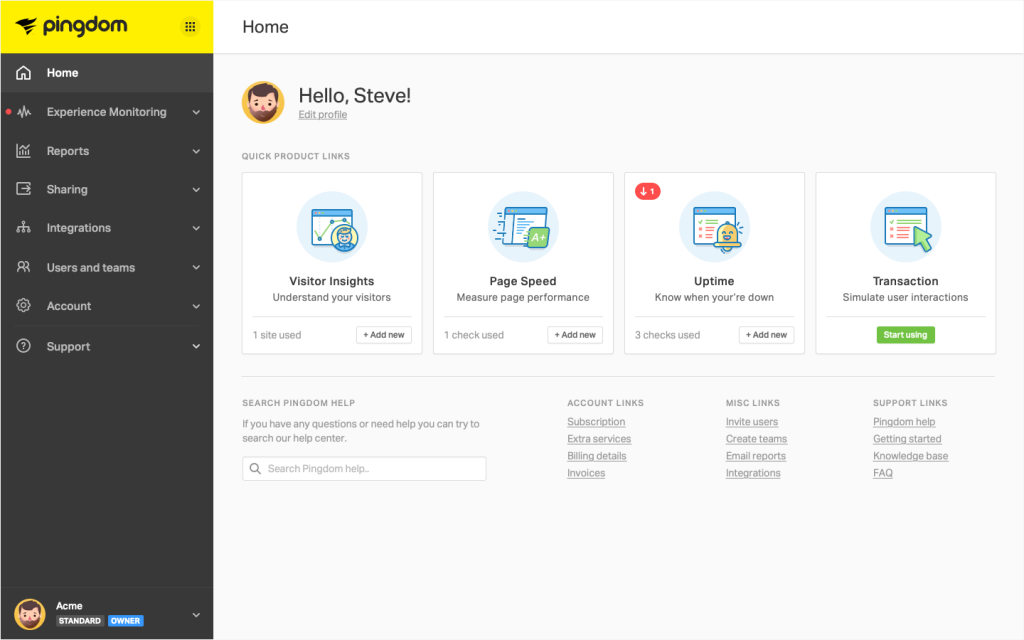
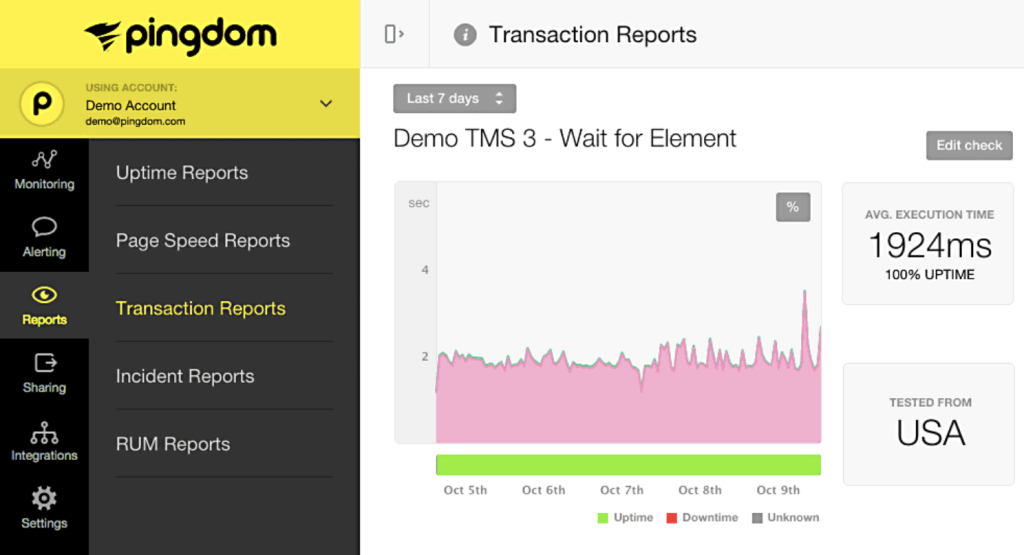
Pingdom

Site: https://www.pingdom.com/
Pingdom is a go-to tool for testing website speed, especially popular among small business owners and marketers. Its main draw is its user-friendly interface, making it easy for anyone to understand the results. The service provides an overall performance score on a scale of 0 to 100 and lists specific issues impacting performance.

A key advantage of Pingdom is the ability to select a specific geolocation for testing. This means you can see how your site loads for users in the USA, Europe, or Asia. This is vital for international projects, as a site may perform well in one region but lag in another due to network delays.
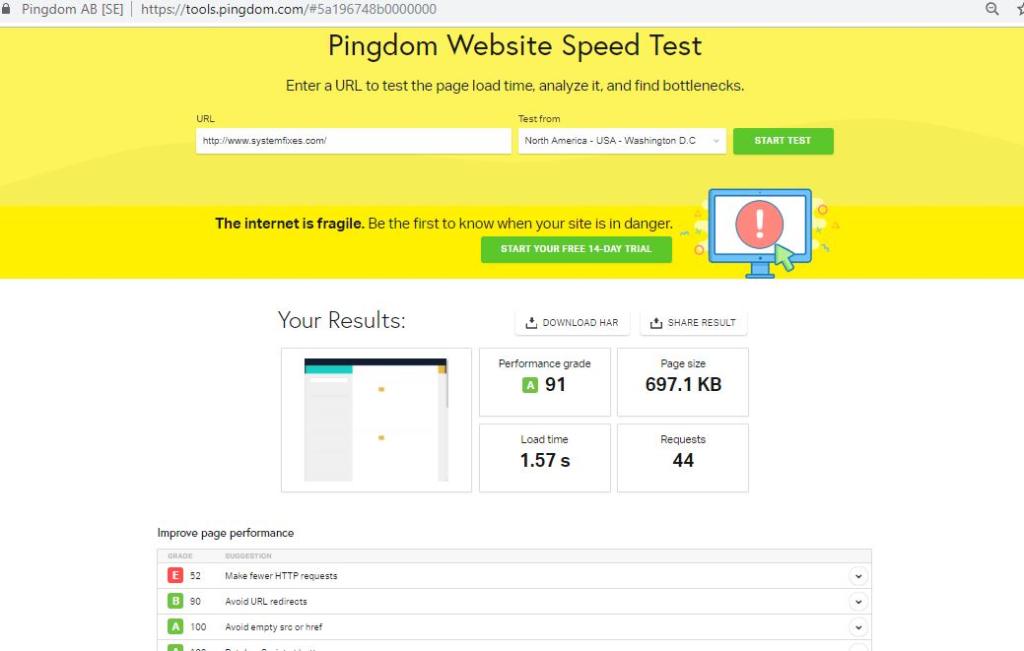
The analysis results include:
- Page load time: How many seconds it takes to fully display content.
- Page size: The total size of all elements (images, CSS, JavaScript).
- Number of HTTP requests: An indicator that directly affects speed, as each request takes time to process.
- Waterfall diagram: A visualization of the loading process, showing which resources load quickly and which slow down the site.
Pingdom also tracks the history of test results, helping you analyze progress after optimizations. For example, after reducing image sizes or configuring the cache, you can compare the new report with the old one.
Importantly, Pingdom doesn’t just provide raw numbers. It offers actionable recommendations, like minifying CSS, enabling gzip compression, and using browser caching.
The reports are practical and easy to understand, even for novices. Additionally, Pingdom offers paid features for monitoring website availability, sending alerts via email or SMS if the site goes down.
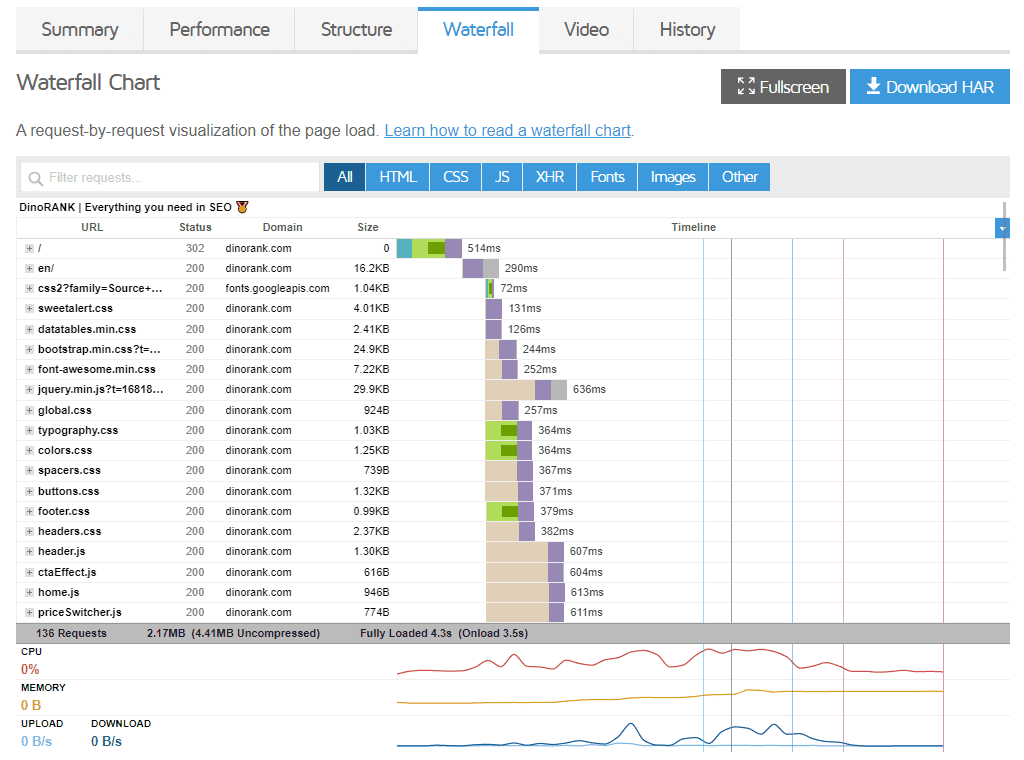
GTmetrix

Site: https://gtmetrix.com/
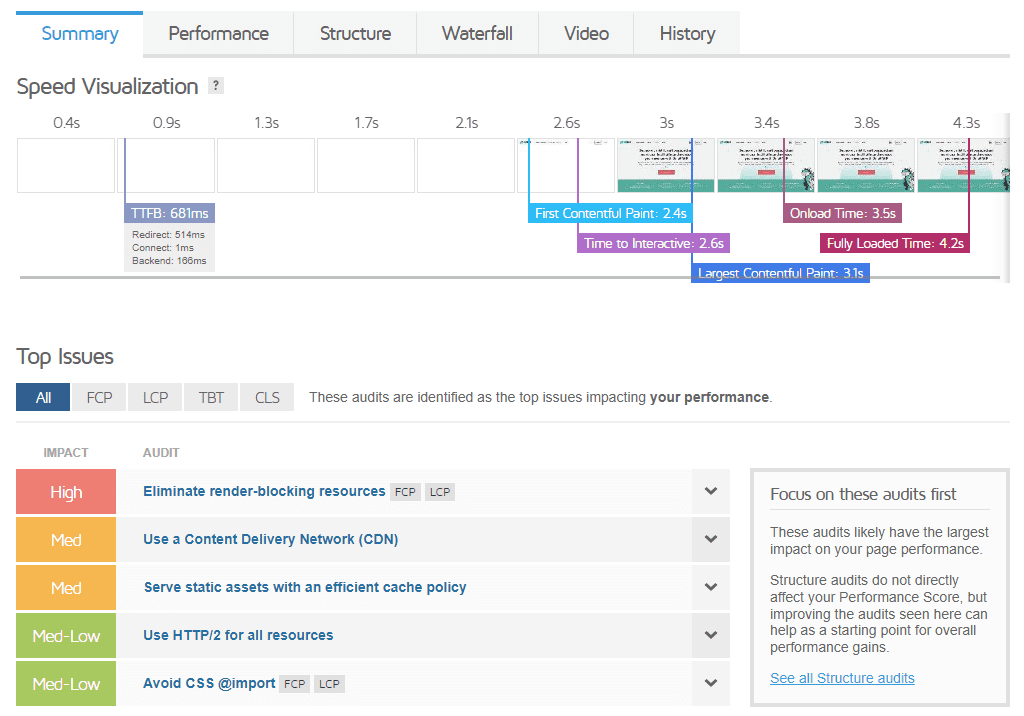
GTmetrix is a favorite among SEO specialists, developers, and agencies for analyzing website speed. Its main feature is the combination of proprietary metrics with the Google Lighthouse engine.
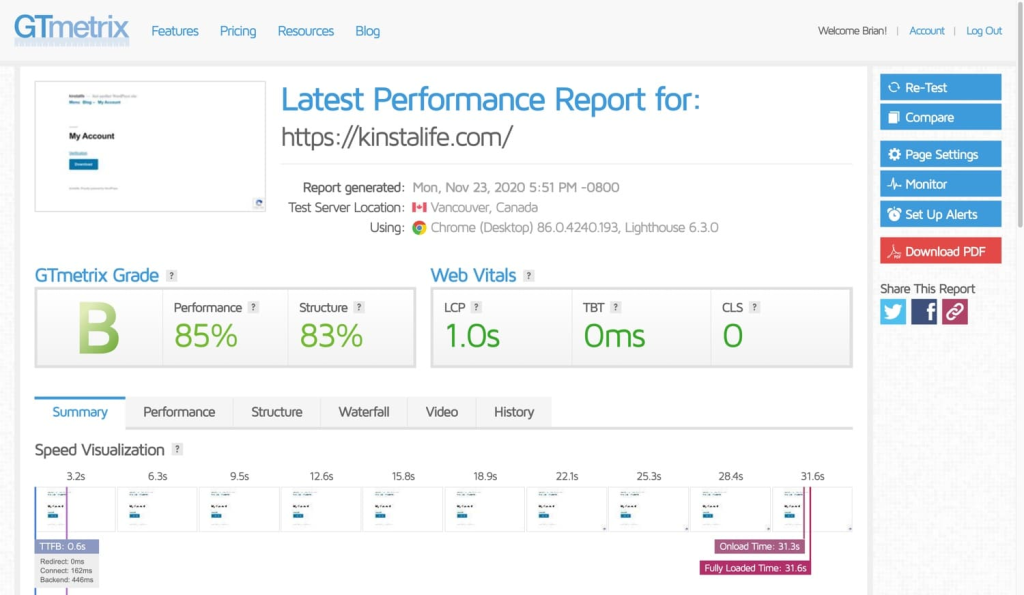
The service provides an overall grade in an A to F format, which is more user-friendly than percentages. GTmetrix delivers a detailed report that includes:
- Loading time (Fully Loaded Time): When the site is completely ready for use.
- Page size and number of requests: Key indicators that affect speed.
- Core Web Vitals: LCP, INP, CLS, which are essential for user experience.
- Waterfall chart: A step-by-step diagram of loading all site elements to quickly identify bottlenecks.
One of GTmetrix’s strengths is its flexible test settings. Users can select server locations (like London, Vancouver, or Mumbai), browsers (Chrome or Firefox), and connection types (from 3G to high-speed Wi-Fi). This allows for realistic simulations of the site’s audience conditions.
In addition to one-time checks, GTmetrix supports dynamic monitoring. You can set up automatic tests to run daily or weekly, generating graphs that show how performance changes after optimizations.
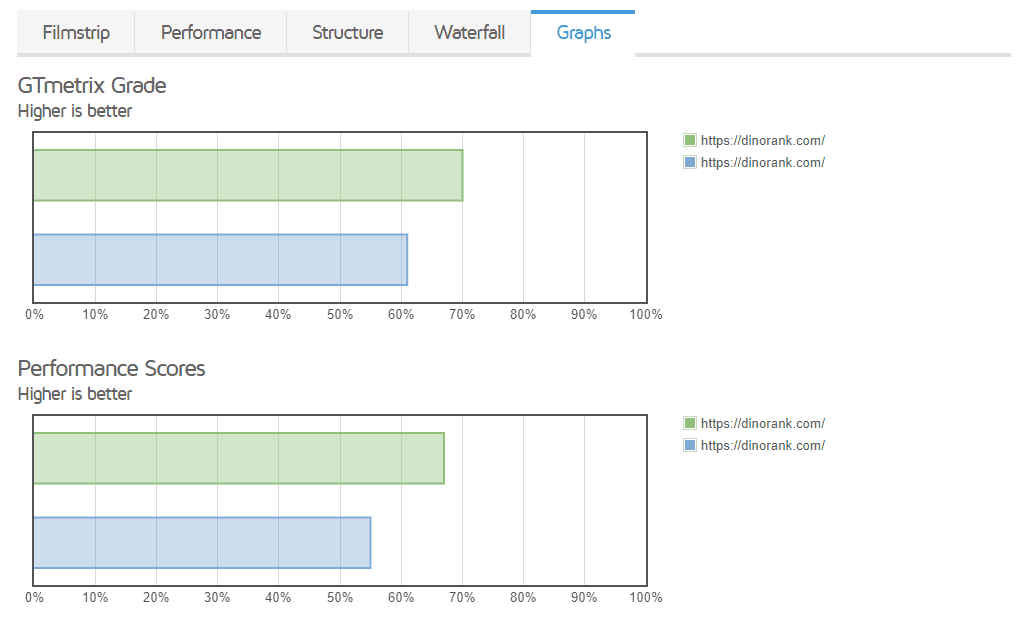
Another cool feature is the ability to compare results. For instance, if you tested the site before and after installing a caching plugin, GTmetrix highlights the differences in speed and performance scores, making it easy to demonstrate effectiveness to clients.
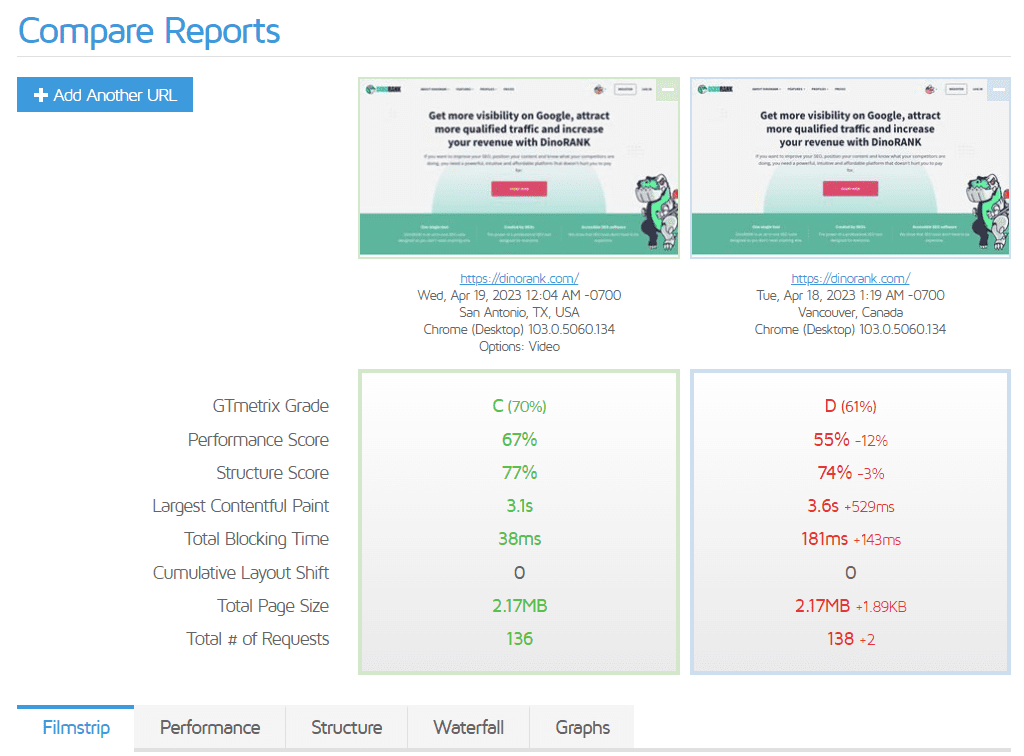
GTmetrix offers a free version that meets basic needs, but a subscription is necessary for full access to all server locations, advanced monitoring features, and extended historical data.
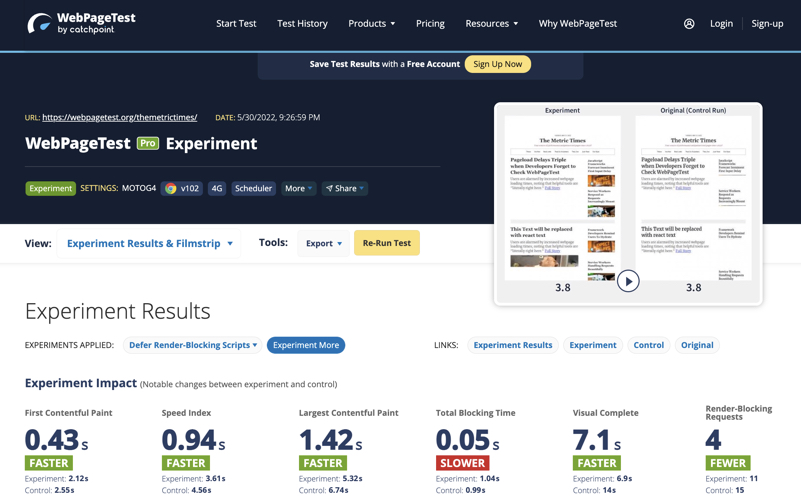
WebPageTest

Site: https://www.webpagetest.org/
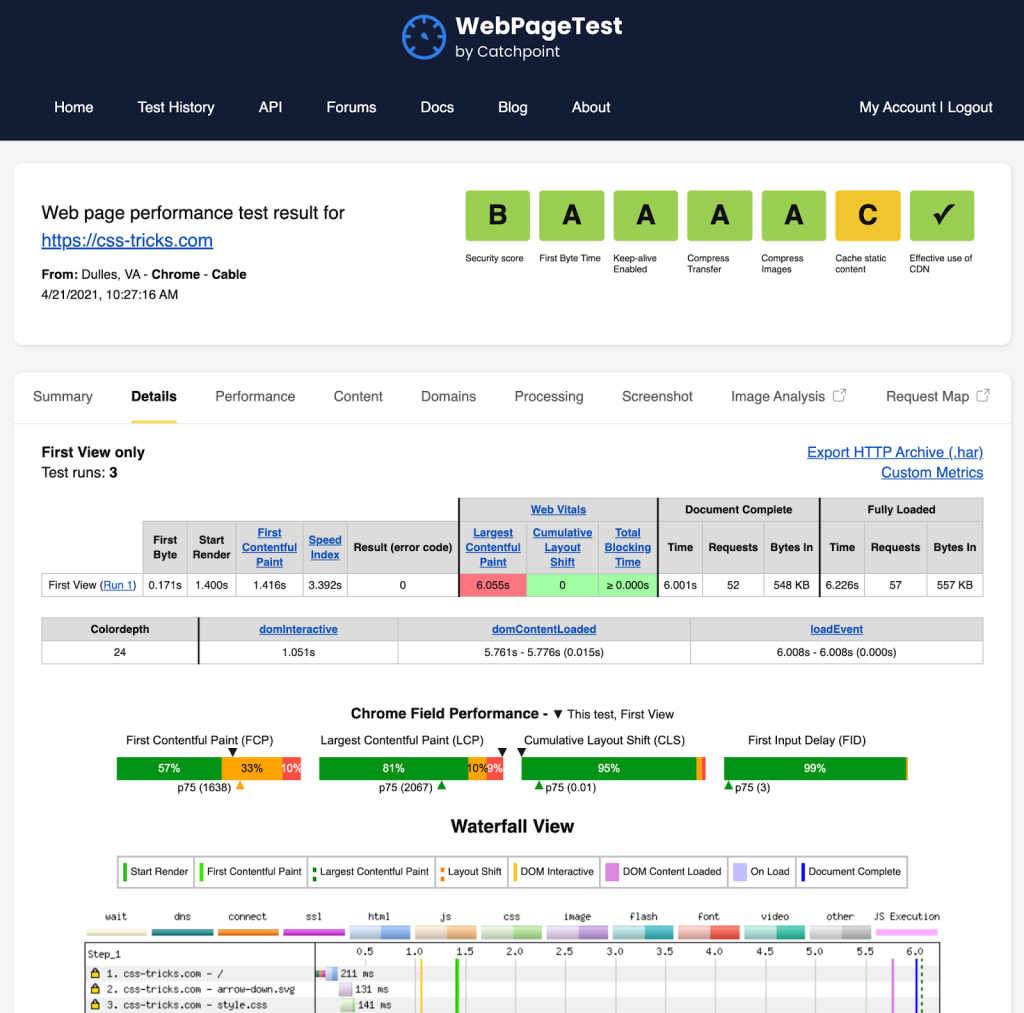
WebPageTest is one of the most advanced tools for analyzing website speed. Its standout feature is the in-depth view it provides of page loading, offering data that’s often overlooked by other services. Designed for performance experts, this tool delivers comprehensive insights into how your site performs.
The primary distinction between WebPageTest and simpler solutions is its flexibility in test settings. Users can customize their tests by selecting:
- Server geolocation: Choose from over 30 locations worldwide.
- Browser: Options include Chrome, Firefox, Edge, and even older versions for backward compatibility.
- Device: Test on either desktop or mobile emulation.
- Connection type: Simulate conditions ranging from high-speed fiber optics to slow 3G.
This allows you to simulate real audience conditions. For example, if you have users in India with slow internet speeds, you can check how exactly the site loading will look for them.
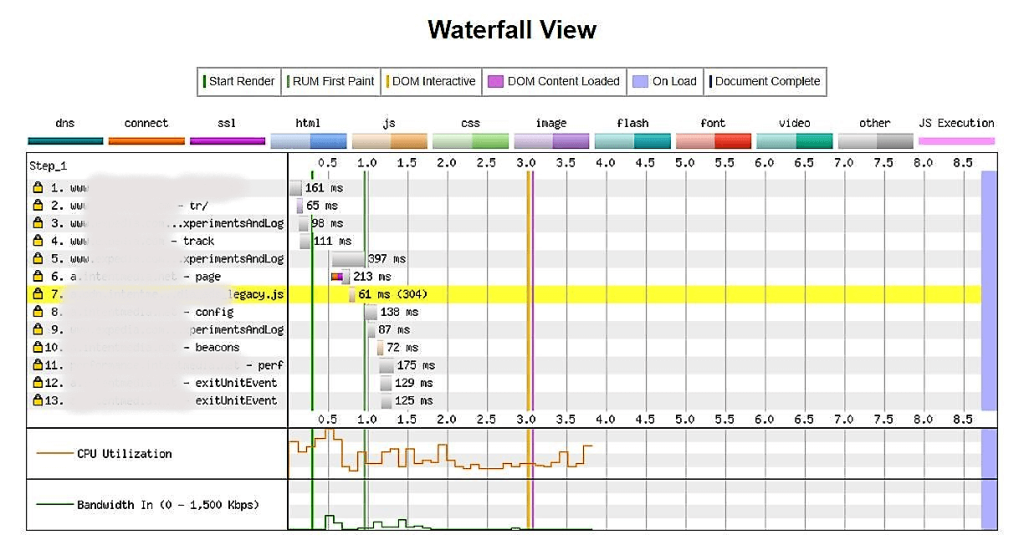
WebPageTest reports include:
- A waterfall view: A detailed diagram showing the loading sequence of each resource (scripts, images, fonts) with precise timing in milliseconds.
- A filmstrip view: A unique feature that displays how the site appeared during loading, literally “frame by frame.”
- Some advanced metrics: Key indicators like First Byte, Start Render, and Speed Index, which help assess not just technical response times but also the user’s visual experience.
- Core Web Vitals: Standard Google metrics presented in a dedicated section, highlighting essential performance factors.
The ability to run script scenarios is a game-changer for developers. This feature allows you to not only test the main page but also simulate user journeys, such as “the user opened the main page → browsed the catalog → added a product to the cart.” This approach helps pinpoint where delays occur in real user scenarios.
Another strong advantage of WebPageTest is its API and automation capabilities. It can be seamlessly integrated into your CI/CD pipeline, enabling performance monitoring at every stage of development. This is particularly beneficial for large projects, as it helps prevent performance degradation during updates.
However, WebPageTest can be complex for beginners. Unlike Pingdom or GTmetrix, its interface is less intuitive, and interpreting the results often requires technical knowledge. Yet, this depth of information makes it an invaluable tool for professionals.
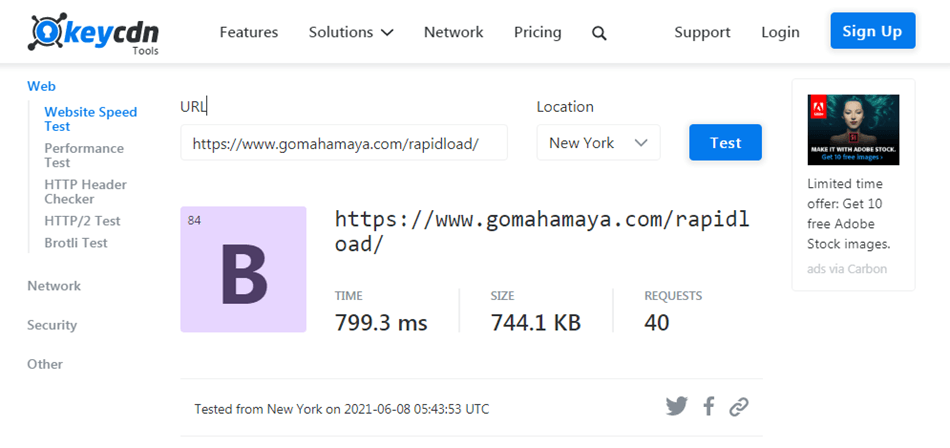
KeyCDN Website Speed Test

Site: https://tools.keycdn.com/speed
KeyCDN Speed Test is a lightweight and user-friendly tool for checking website speed, developed by the CDN provider KeyCDN. Unlike more complex services like WebPageTest or GTmetrix, it’s incredibly straightforward to use: simply enter the URL and choose one of the available testing locations.
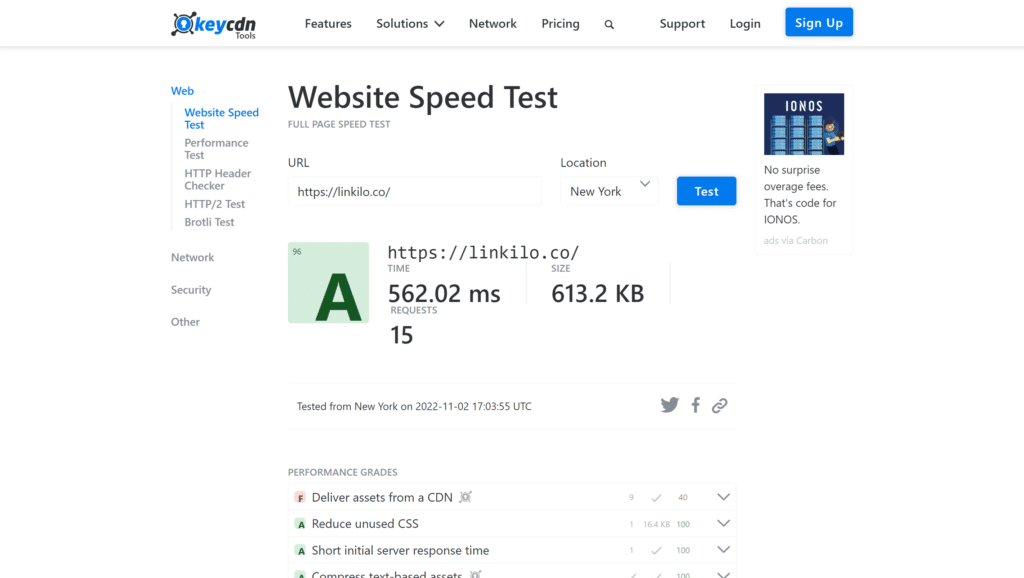
The standout feature of KeyCDN Speed Test is its emphasis on essential metrics, avoiding unnecessary data overload. In the report, users receive:
- The total page load time: How long it takes for the page to fully load.
- Page size: The total content size in kilobytes or megabytes.
- The number of HTTP requests: The total requests made, which can impact loading speed.
- And a waterfall diagram showing the loading sequence of all elements.
This focus allows you to quickly pinpoint problem areas, such as oversized images, blocking scripts, or resources that load slowly. This makes the tool ideal for quick diagnostics when a detailed audit isn’t necessary, providing a clear general overview instead.
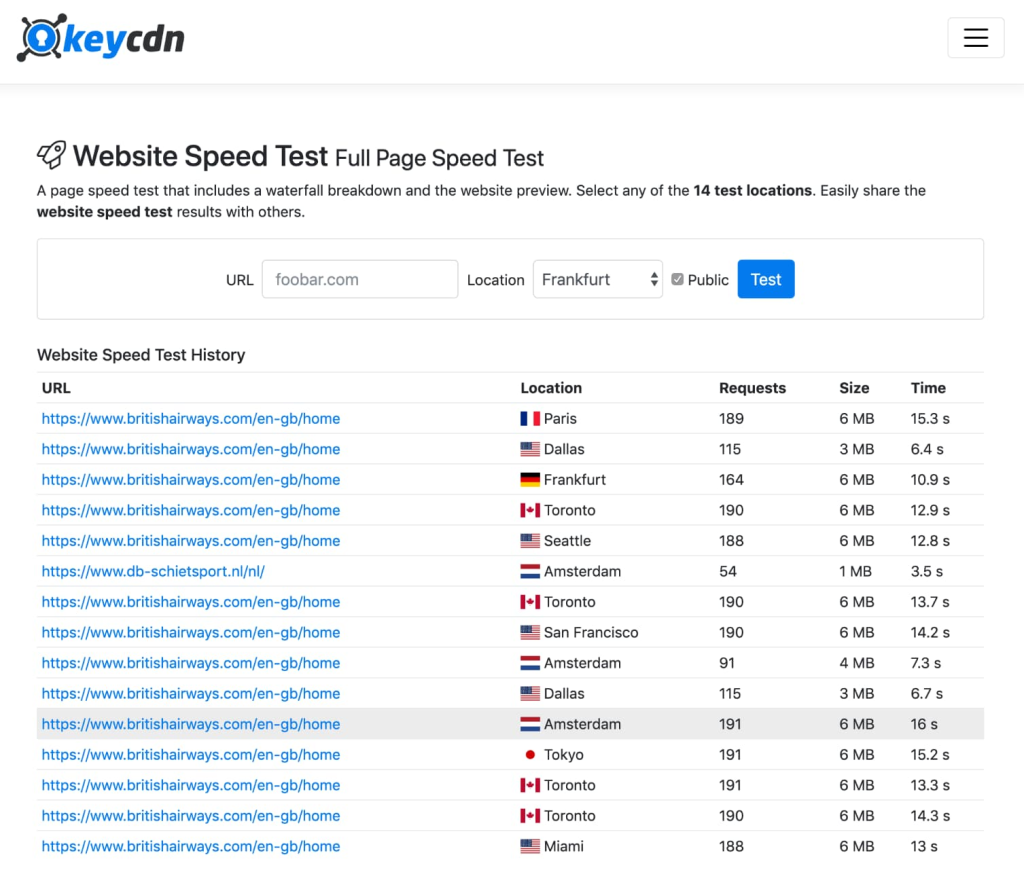
Interestingly, the service allows you to run tests from multiple locations around the globe, although the list is somewhat limited. This feature helps you gauge how well your website performs for an international audience and is particularly useful for those using a CDN to verify if the content delivery network is effectively reducing latency.
Unlike Google PageSpeed Insights or WebPageTest, KeyCDN doesn’t bombard you with excessive technical metrics. This makes it especially valuable for non-technical users, such as marketers, business owners, or project managers, who seek clear and easily digestible information.
The main limitation of KeyCDN Speed Test is that it doesn’t provide any optimization recommendations. It highlights the “symptoms” but doesn’t offer the “cure.” As a result, in practical use, the KeyCDN Website Speed Test is often utilized as a quick status indicator before transitioning to more comprehensive services like GTmetrix or Lighthouse for deeper analysis.
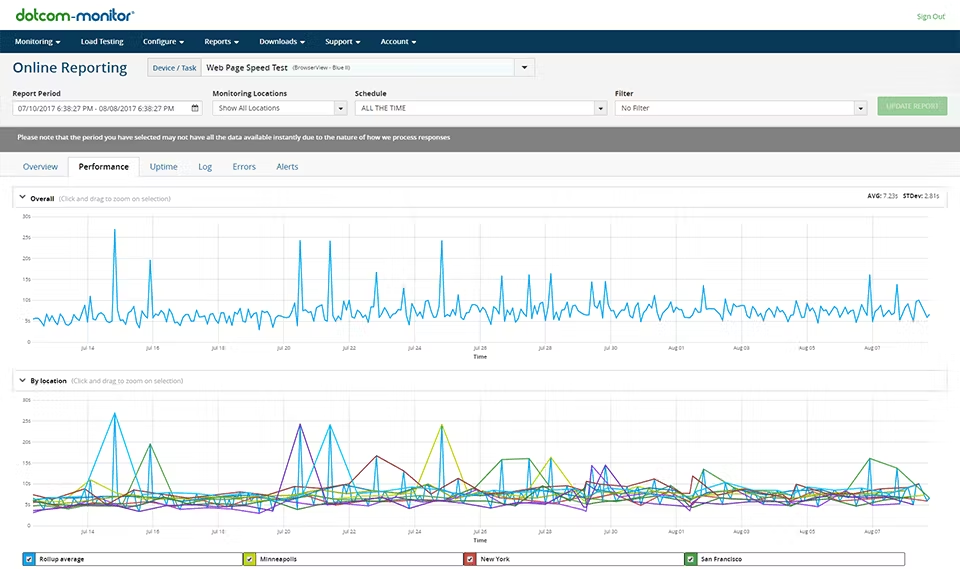
Dotcom-Monitor
Site: https://www.dotcom-monitor.com/
Dotcom-Monitor is a robust tool for testing and monitoring website performance, ideal for both one-time checks and ongoing availability monitoring. Its standout feature is the ability to conduct tests from over 20 global locations and select different browsers, including Chrome, Firefox, Edge, and even… Internet Explorer.
Unlike simpler services like Pingdom or KeyCDN, Dotcom-Monitor offers more flexible options for modeling conditions. For instance, you can specify the connection type, ranging from fast Wi-Fi to DSL or even slow 3G. This capability allows you to see how the site performs for users with varying internet speeds.
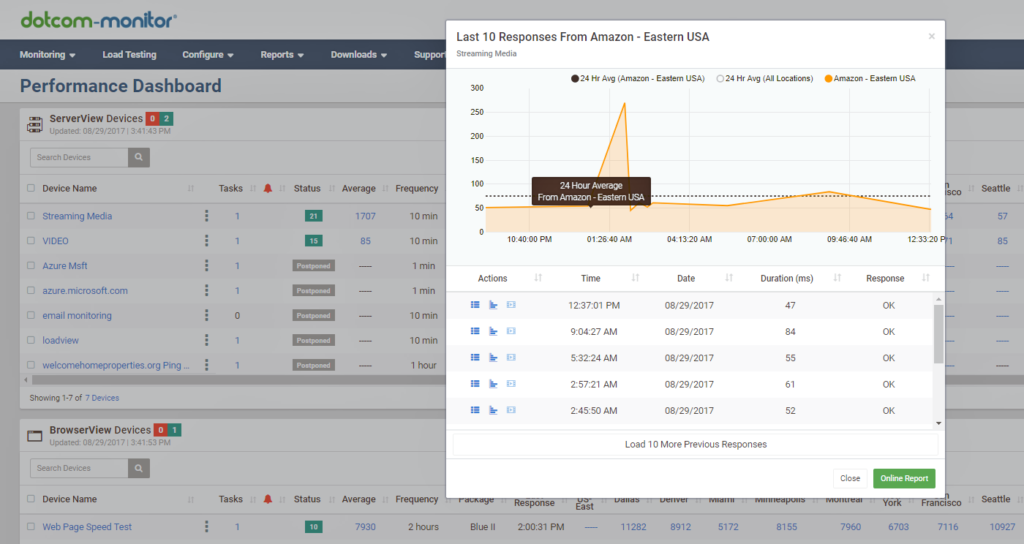
The analysis results include:
- Total page load time: For each resource.
- Page size and number of requests: Key indicators that affect performance.
- Waterfall diagram: A detailed view showing the exact load time of each element.
- Core Web Vitals: Along with other essential metrics.
- Action scenario recording: The ability to simulate user actions (like navigating through pages or filling out a form) and measure their performance.
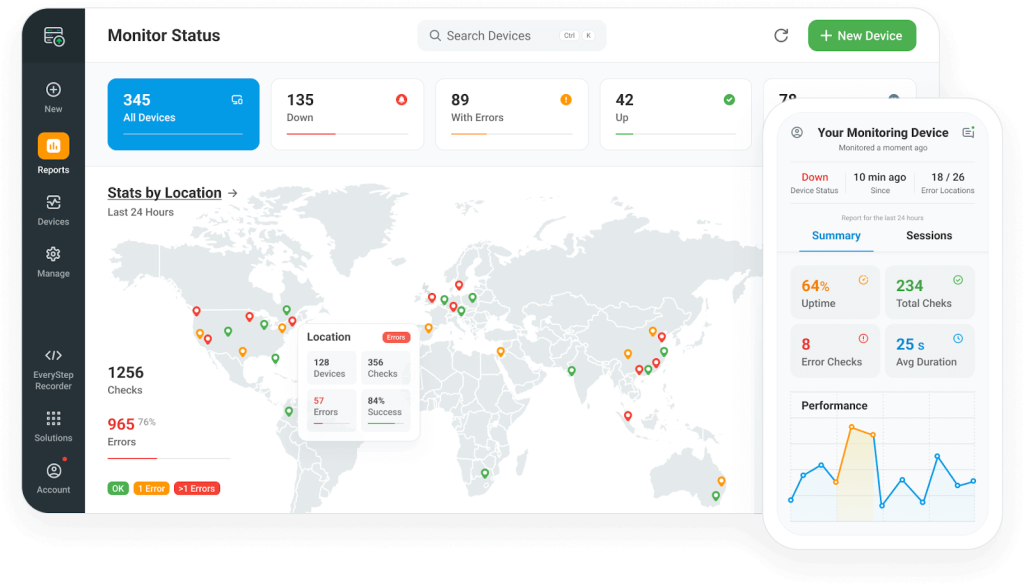
Another significant advantage of Dotcom-Monitor is its ability to provide real-time monitoring. The service can track your site’s availability and send notifications if it becomes unavailable or experiences slow performance. This feature is especially crucial for online stores and large-scale services, where even a brief downtime can lead to substantial financial losses.
The tool integrates seamlessly with corporate processes, offering support for APIs, detailed reporting, and group notifications. It’s frequently utilized by DevOps and QA teams for load testing and monitoring site stability throughout the day.
However, for beginners, Dotcom-Monitor can feel overwhelming and complex. Its interface isn’t as intuitive as that of GTmetrix or Pingdom, and some features are only accessible through paid plans.
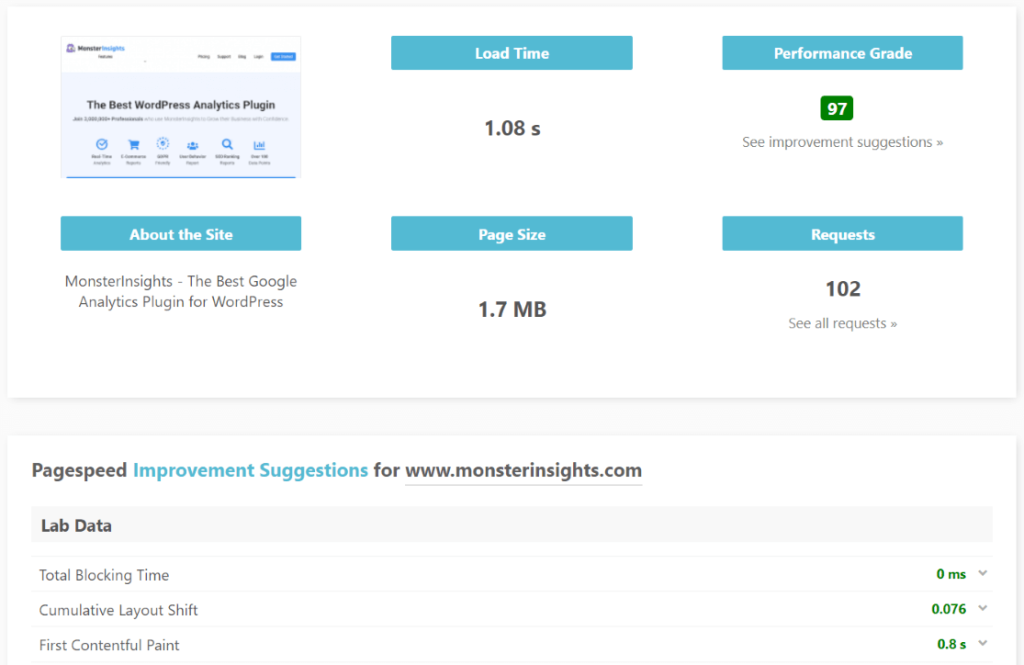
IsItWP Website Speed Test Tool

Site: https://www.isitwp.com/free-website-speed-test-tool-for-wordpress/
IsItWP Website Speed Test Tool is a specialized tool designed for checking website speed, specifically tailored for WordPress projects. It’s user-friendly and aimed at owners of blogs, online stores, and corporate websites that run on the world’s most popular CMS.
The main advantage of the IsItWP Speed Test Tool is its ability to analyze sites using key metrics (loading time, page size, and number of requests) and provide clear, actionable recommendations right away. For example, it may suggest setting up and configuring a caching plugin, optimizing images with specialized plugins, deactivating unnecessary extensions or choosing a lightweight theme.
This tool not only identifies problems but also offers solutions in a format that’s convenient for WordPress users, who may not have extensive technical knowledge.
Additionally, IsItWP Speed Test displays Core Web Vitals (those LCP, FID, and CLS), helping you understand how real users perceive your site. It also clearly indicates which elements are slowing down loading times, such as scripts, images, or CSS.
The service is frequently used not just for one-time checks but also as a starting point before optimization. For instance, a blog owner can run a test, receive basic recommendations, implement them using a couple of plugins, and see a noticeable improvement.
It’s worth noting that the tool is completely free and doesn’t require registration. However, in terms of depth of analysis, it’s less comprehensive than services like GTmetrix or WebPageTest. It serves as a simplified version of speed testing, with a strong emphasis on practical applicability within the WordPress ecosystem.
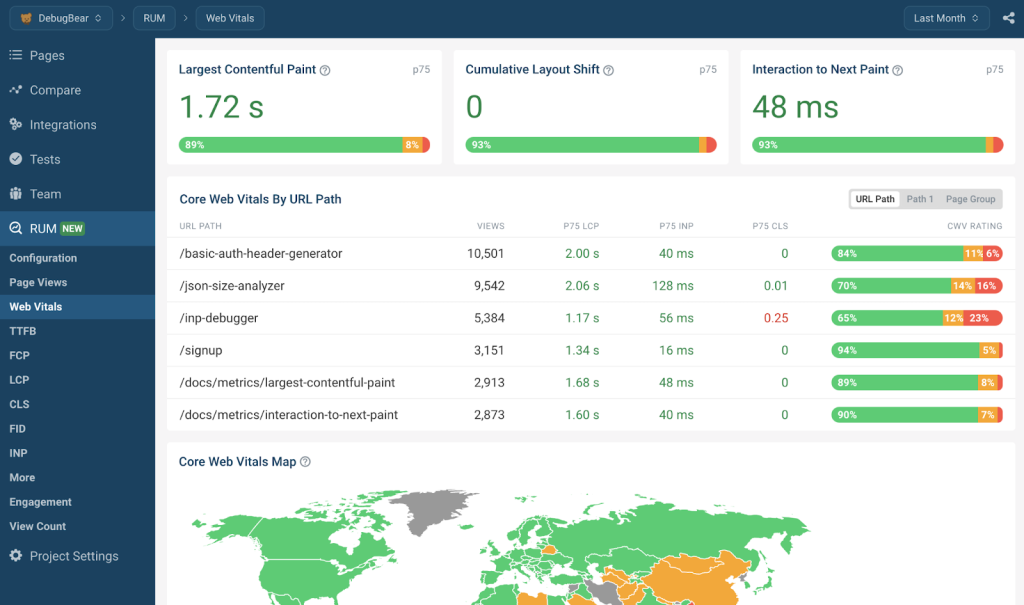
DebugBear

Site: https://www.debugbear.com/
DebugBear is a more engineering-focused tool for analyzing website speed, emphasizing detailed technical diagnostics and continuous monitoring. While Google PageSpeed Insights and GTmetrix are ideal for quick checks, DebugBear is tailored for developers and teams that prioritize in-depth analytics and quality control throughout the entire product lifecycle.
The standout feature of DebugBear is its use of real user data (Real User Monitoring, RUM). The service gathers statistics not only from lab tests but also from actual user sessions, providing insights into how the site performs for real visitors. This is particularly beneficial for large projects where the audience accesses the site from various devices and networks.
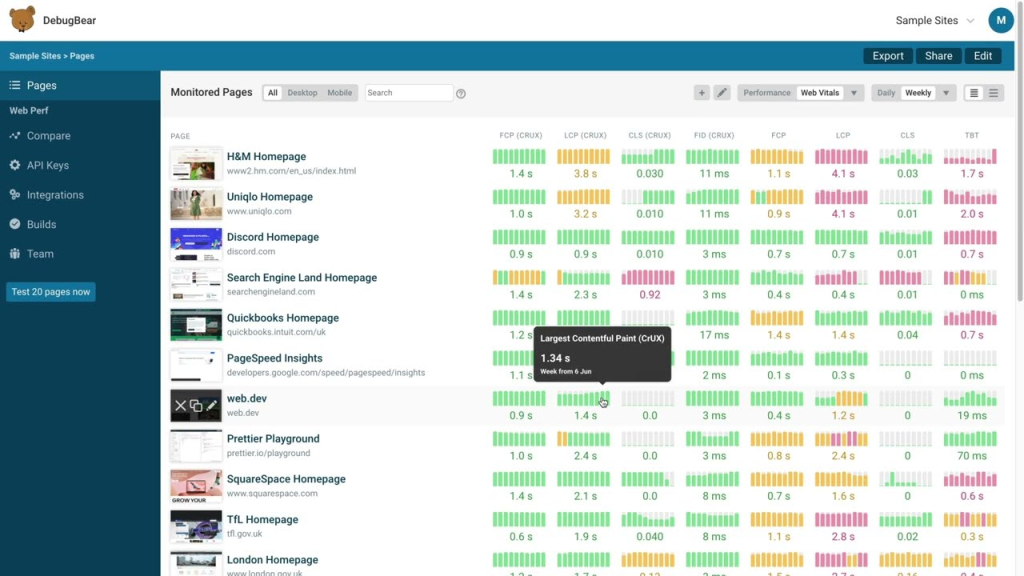
The tool analyzes all key performance metrics, including:
- Core Web Vitals: LCP, INP, and CLS.
- Time to First Byte (TTFB): The time it takes for the server to respond.
- Script loading delays: Identifying any bottlenecks in script execution.
- Rendering speed and UI stability: Assessing how quickly the interface becomes interactive and stable for users.
However, unlike simpler services, DebugBear offers a detailed breakdown of each resource, highlighting issues such as thread locks, heavy JavaScript, and caching problems. The interface is tailored for developers, with reports that include technical details to help identify specific sections of code or resources that are slowing down loading times.
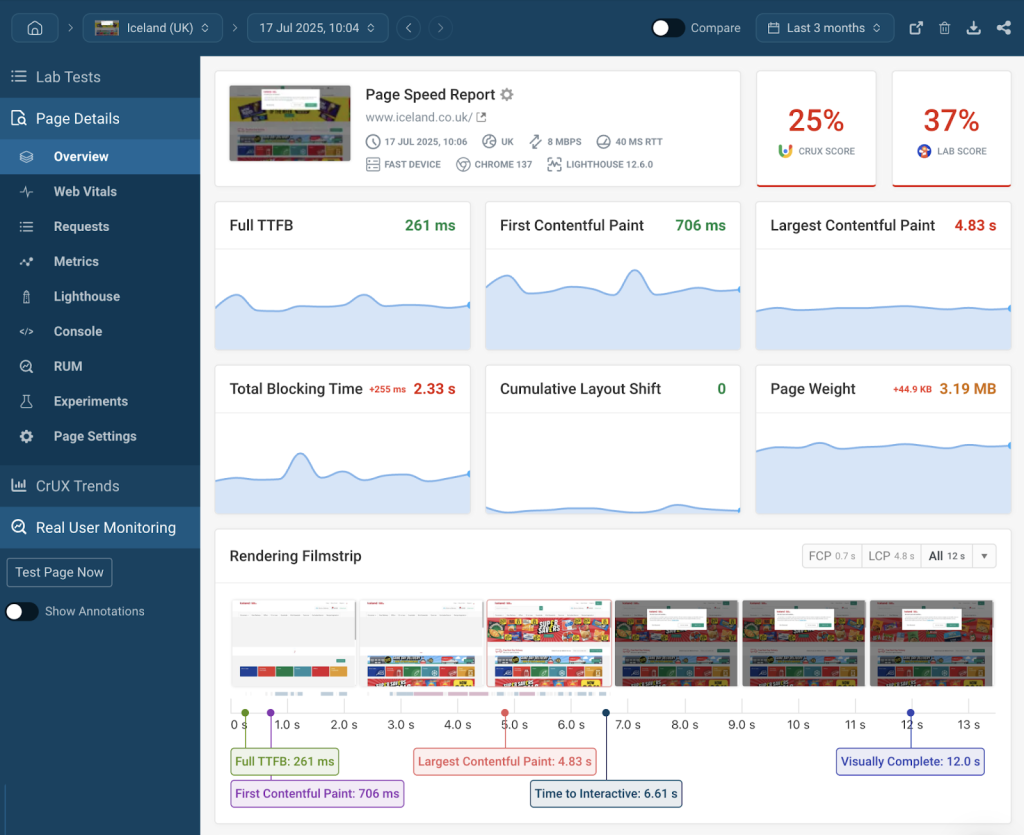
DebugBear is also excellent for long-term monitoring. You can schedule regular checks (daily or weekly) and track metric trends through visual graphs. Additionally, the service sends notifications if metrics begin to decline, such as after adding a new plugin or deploying a frontend update.
Integrations are another plus. DebugBear can be connected to CI/CD pipelines, Slack, GitHub, and other services. This allows you to automate quality control. If a new release “breaks” performance, the team will know about it immediately.
One disadvantage is that DebugBear is primarily aimed at advanced users. Novices may find it challenging to interpret the reports without a foundational understanding of web development.
Additionally, DebugBear is a paid service. While it offers a trial, a subscription is necessary for full access to its features.
Lighthouse

Site: https://chromewebstore.google.com/detail/lighthouse/blipmdconlkpinefehnmjammfjpmpbjk
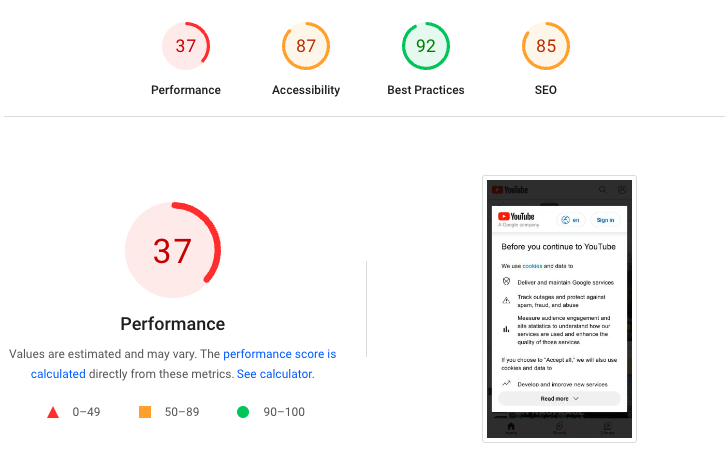
Lighthouse is an official open-source tool from Google designed for comprehensive website audits. Unlike many other services, it goes beyond just speed analysis. Lighthouse evaluates a site across five key areas: performance, accessibility, best practices, SEO, and Progressive Web App (PWA) compliance. This makes it a versatile assistant for developers and SEO specialists alike.
The main advantage of Lighthouse is its flexibility and integration capabilities. It can be launched in several ways:
- Directly in the Chrome browser via the DevTools tab.
- As a Node.js command, which is convenient for CI/CD processes.
- Through PageSpeed Insights, where Lighthouse results are combined with real-user data from the Chrome UX Report.
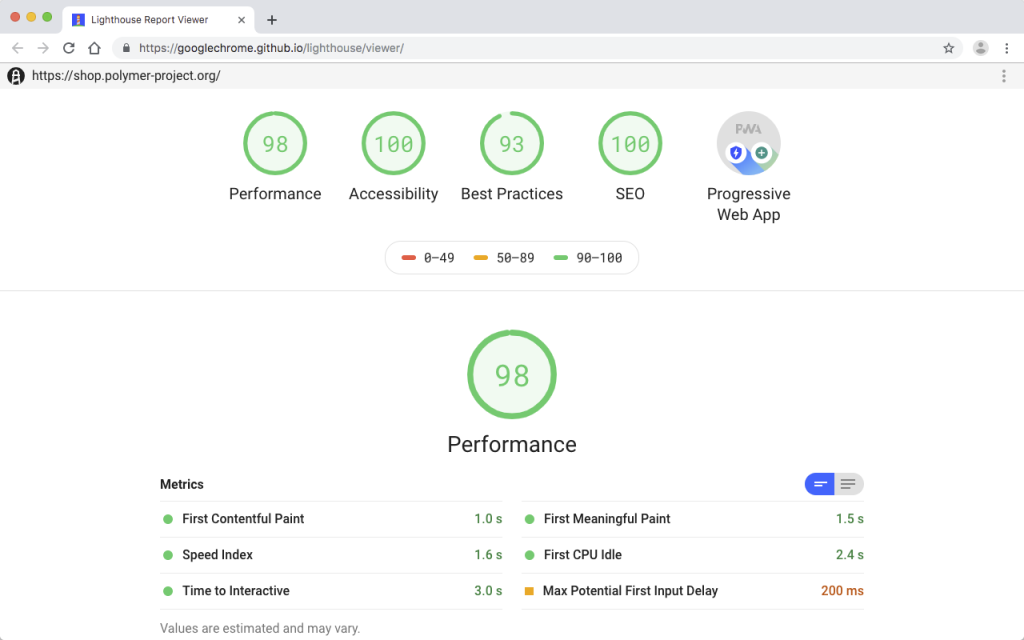
Lighthouse utilizes an engine that simulates real-world page loading conditions by throttling the connection and limiting CPU performance. This approach demonstrates how the site performs for users on average or even low-end devices. The report includes key metrics such as Largest Contentful Paint (LCP), Interaction to Next Paint (INP), and Cumulative Layout Shift (CLS), along with indicators like Time to Interactive (TTI) and Speed Index.
Lighthouse reports are structured clearly and concisely, featuring color indicators (green, yellow, red) that quickly highlight areas needing attention. Additionally, the tool offers specific recommendations for improvement, such as “optimize images,” “defer loading unnecessary scripts,” and “reduce CSS size.”
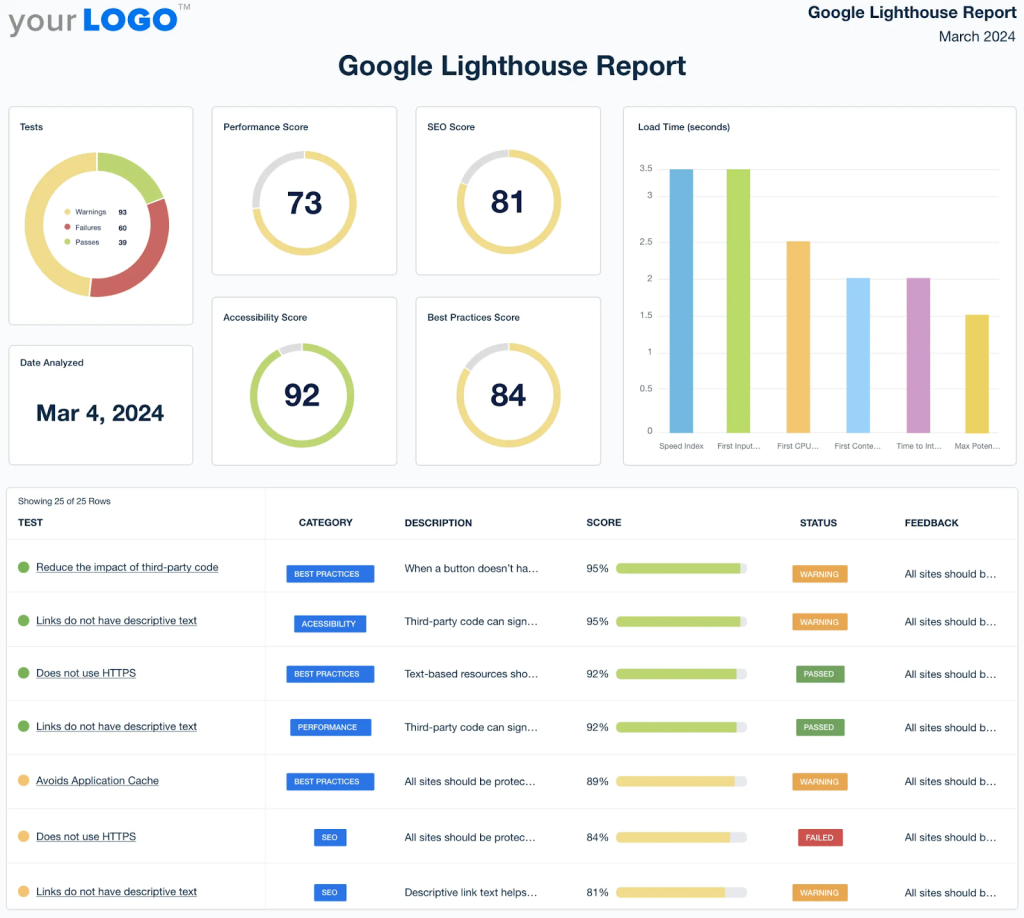
Lighthouse is also valuable for teams focused on product quality, as it assesses the site’s accessibility (including alt texts, contrast, and semantics) and compliance with SEO requirements (such as correct meta tags and structured data). Additionally, it offers guidance on converting the site into a Progressive Web App (PWA), covering aspects like installing a manifest, enabling offline mode, and ensuring HTTPS support.
Another strong advantage of Lighthouse is its automation capabilities. It integrates seamlessly with CI/CD processes, allowing you to test the performance and quality of your code with each release. This integration makes it an essential part of the DevOps workflow, helping to prevent performance regressions.
However, the downside of Lighthouse is that it is more suited for developers than for regular website owners. Beginners may find its reports overwhelming due to the technical details presented. Yet, it’s precisely this depth and versatility that professionals appreciate. Lighthouse not only measures speed but also aids in building high-quality, fast, and user-friendly websites.
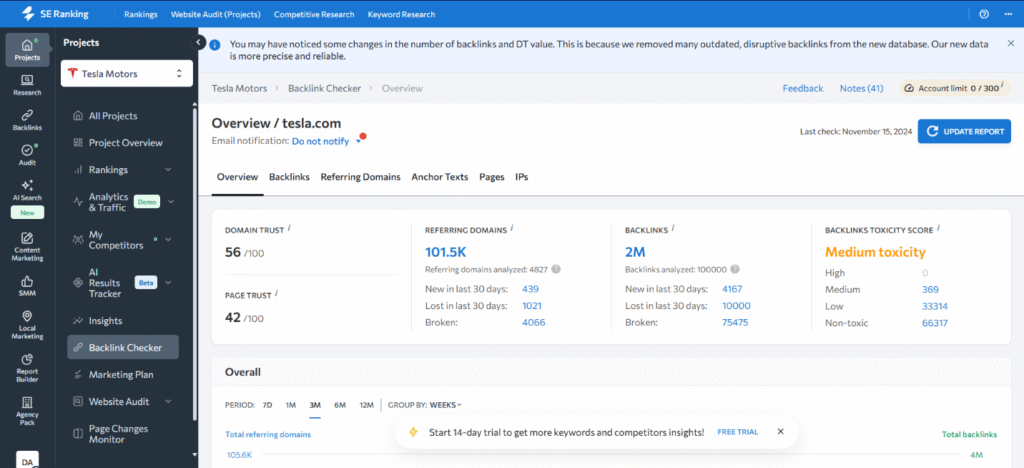
SE Ranking’s Website Speed Test

Site: https://seranking.com/free-tools/website-speed-test.html
SE Ranking’s Website Speed Test is part of the multifunctional SE Ranking platform, which is primarily recognized for its SEO tools. Unlike highly specialized services like GTmetrix or WebPageTest, this tool considers website speed as an additional factor that influences search rankings.
The main feature of this tool is its simplicity and seamless integration with the SEO ecosystem. During the test, key performance metrics are analyzed, including Core Web Vitals. The report evaluates loading time, server response speed, interface stability, and overall user experience.
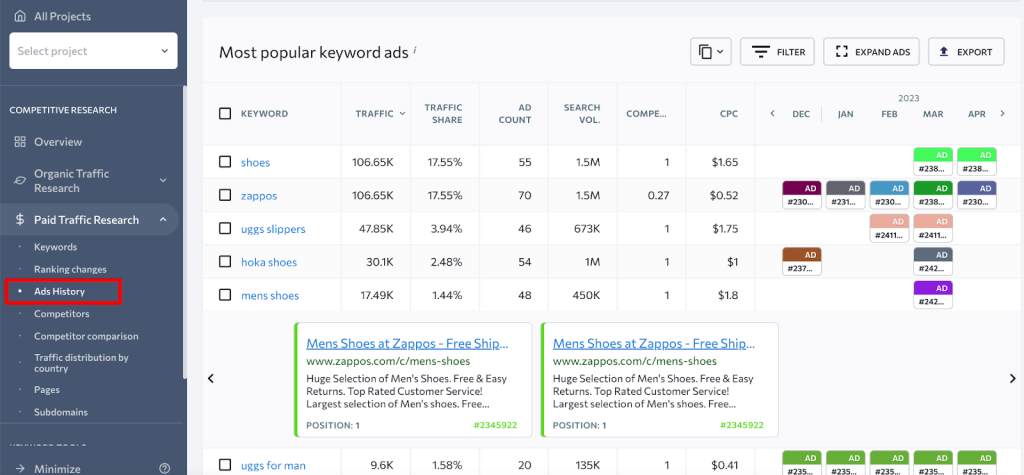
Unlike Lighthouse or WebPageTest, SE Ranking presents results without overwhelming users with technical details. The focus is on data that is easily understandable for marketers and SEO specialists. For instance, the tool might indicate, “the page loads slowly, which may hurt your search rankings,” or “Core Web Vitals are in the yellow zone; optimization is recommended.”
Interestingly, the speed test results can be conveniently integrated with other data within SE Ranking, such as position analysis, site audits, and competitive analysis. This allows you to see not only that “the site loads slowly” but also how this impacts SEO results and user behavior.
However, the tool has its limitations. Unlike GTmetrix or DebugBear, it does not display detailed waterfall diagrams and lacks in-depth recommendations for developers. Instead, it serves more as a top-level diagnostic tool that helps you identify whether there is a problem, but it doesn’t always specify where to look for the underlying issues.
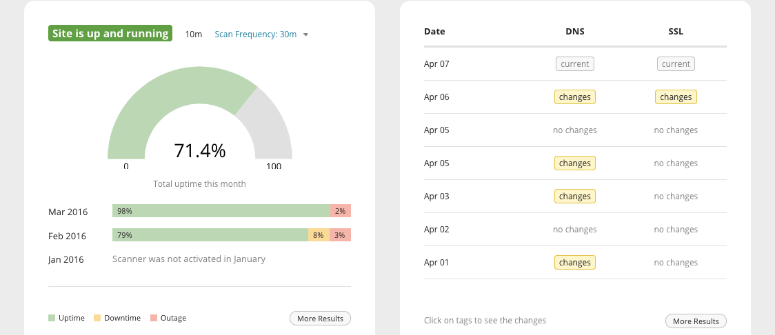
Alertra

Site: https://www.alertra.com/
Alertra is a tool that was initially created not as a classic speed-testing tool, but as a service for monitoring website and server availability. Its main task is to check whether a site functions properly in different parts of the world and notify site owners in case of an outage. However, as part of the check, it also measures response speed and loading time, so it’s often used as a supplementary tool for performance analysis.
The main feature of Alertra is its global monitoring network. The service launches checks from servers located in various countries, allowing you to see how the site performs for users in different regions. For example, a site can load quickly in Europe but noticeably slower in Asia or South America. Such analysis helps identify problems with CDN or traffic routing.
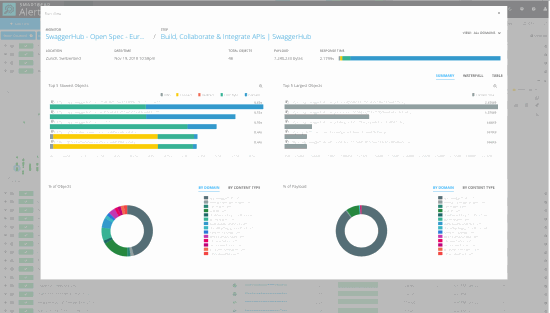
Test results include:
- server response time (ping latency);
- total page load time;
- connection stability;
- error detection (e.g., 404 or 500 codes).
Another strong advantage of Alertra is its real-time notification system. If the site becomes unavailable or experiences a sudden slowdown, the service sends alerts via SMS or email. This feature is particularly valuable for online stores and services, where even a minute of downtime can result in lost customers and revenue.
Unlike tools like GTmetrix or WebPageTest, Alertra does not provide detailed waterfall charts or technical recommendations. Its focus is not on in-depth analysis but on rapid problem notification combined with basic speed metrics.
Gatling
Site: https://gatling.io/
Gatling is a powerful load testing tool, unlike traditional speed-testing tools such as PageSpeed Insights or GTmetrix. While those evaluate how quickly a site loads for a single user, Gatling shows how the system performs under heavy load, when hundreds or thousands of visitors arrive simultaneously.
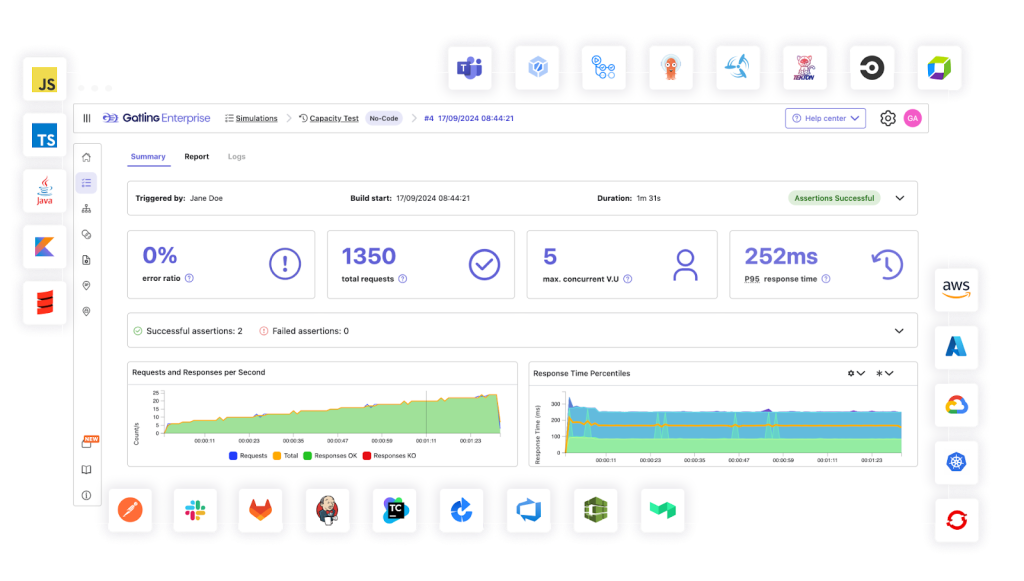
The primary feature of Gatling is its flexibility in testing scenarios. Developers can create custom scenarios, such as “1000 users visit the main page, 500 navigate to the catalog, and 200 place orders.” This approach allows for the simulation of real-world situations, helping to identify bottlenecks in site or application performance.
Gatling is written in Scala, and scenarios are scripted as code, making the tool particularly convenient for developers and DevOps engineers. Unlike more visual solutions like JMeter, Gatling integrates seamlessly into CI/CD processes and can be automatically triggered with each code update to check for performance degradation.
Test results include data such as:
- Average and maximum response time
- Percentage of successful and unsuccessful requests
- Throughput: The number of requests the server can handle per second
- Latency distribution: Identifying which operations slow down performance under load
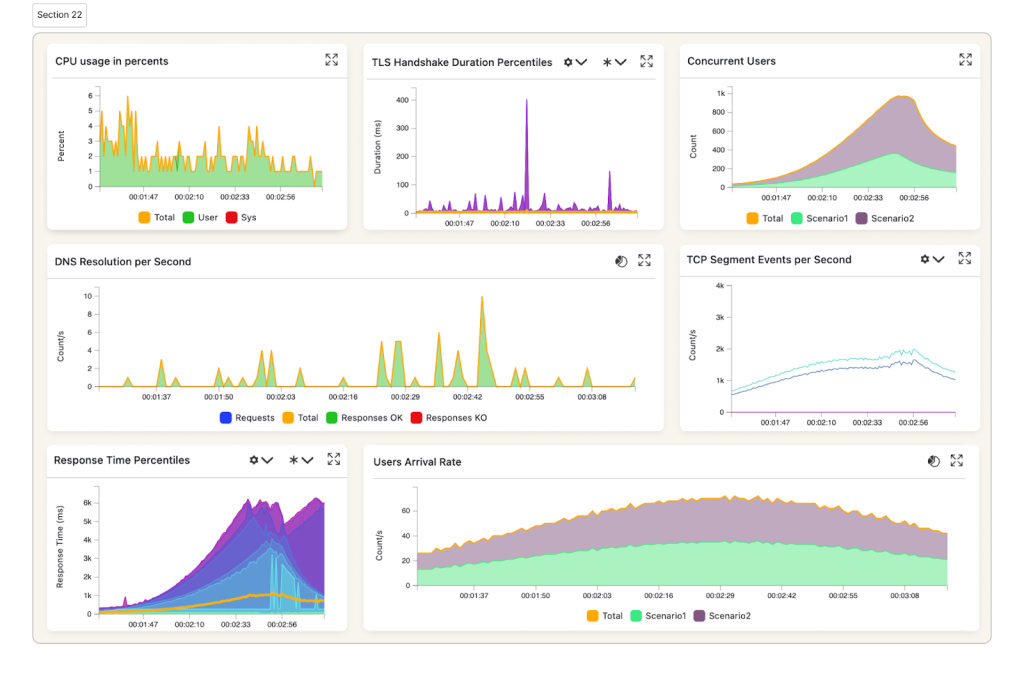
Gatling reports are visualized through graphs and tables, making it easier to analyze even large volumes of data. For instance, you can pinpoint the exact moment the site begins to struggle.
The primary advantage of Gatling is its automation capabilities. It is ideal for agile and DevOps teams, where testing performance at every stage of development is crucial. However, there is a downside: beginners may find it challenging to master this tool, as it requires programming skills and a solid understanding of application architecture.
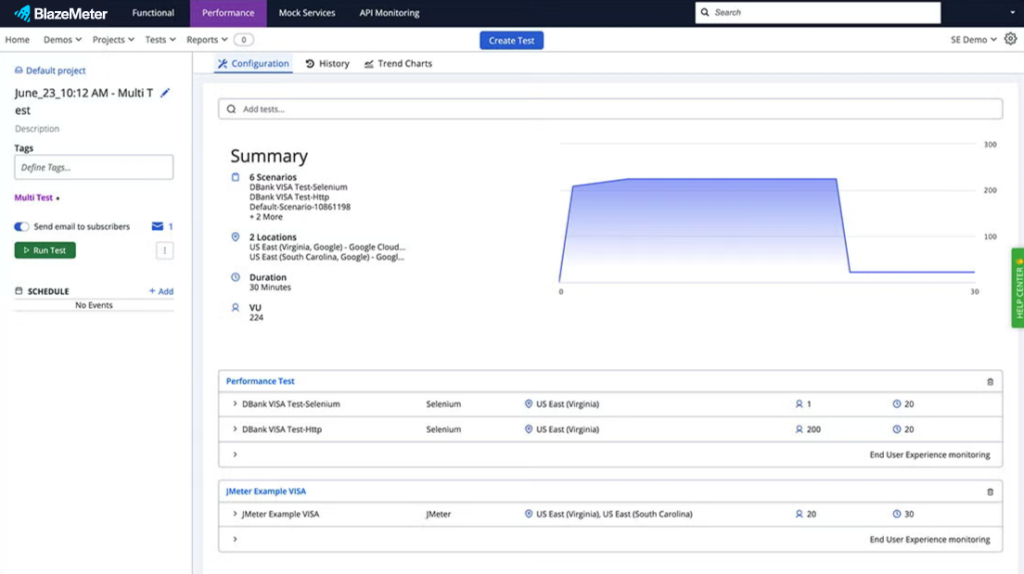
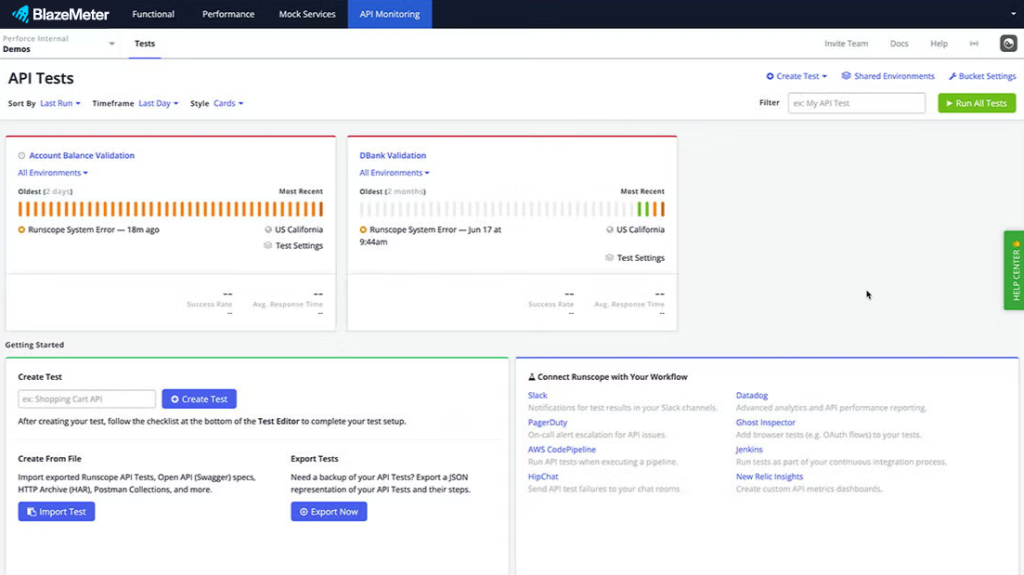
BlazeMeter
Site: https://www.blazemeter.com/
BlazeMeter is a cloud platform for load testing and performance monitoring, designed as an extension of the popular Apache JMeter tool. Unlike JMeter, which requires local installation and configuration, BlazeMeter operates entirely in the cloud, enabling you to conduct large-scale tests without the need for complex infrastructure
The standout feature of BlazeMeter is its scalability. The service can simulate hundreds of thousands of concurrent users from various regions around the globe. For example, you could simulate 50,000 users from the U.S. and Europe visiting the site simultaneously to assess whether the server can handle the load. Ours can! (Give SpaceLama a try)
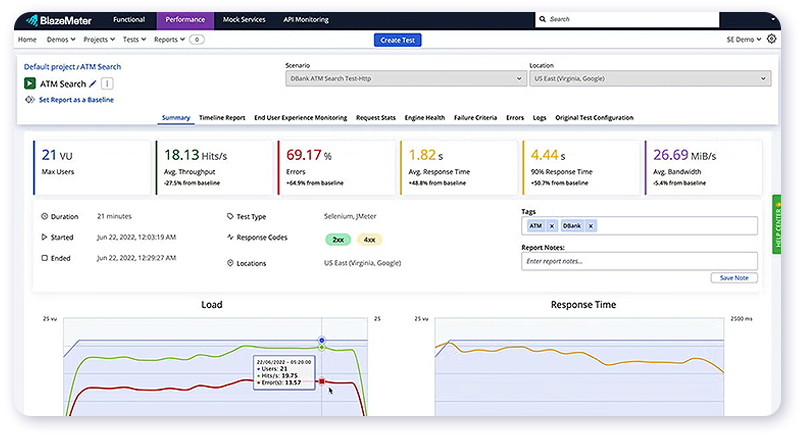
BlazeMeter supports not only web applications, but also API testing, mobile applications, and microservices. This makes it especially useful for modern projects, where systems must remain stable while interacting with numerous services.
Test results include:
- average and peak response time,
- percentage of successful and unsuccessful requests,
- system throughput,
- error rates and latency trends over time.
BlazeMeter provides convenient visualization, presenting reports as graphs that clearly illustrate how the server behaves as the load increases. Additionally, the service supports real-time reporting, allowing you to monitor metrics during the test and halt the test if the system crashes.
Another advantage of BlazeMeter is its integration capabilities. The platform easily integrates into CI/CD processes and works seamlessly with tools such as Jenkins, GitHub, and Azure DevOps. This enables companies to automatically run load tests with each update, helping to prevent issues before release.
However, BlazeMeter has its downsides. Firstly, it is a paid service (as in “it wants your money”). While there is a free trial available, a subscription is required for more extensive scenarios.
Secondly, it may be excessive for small sites. If your project is designed for just a couple of thousand users, BlazeMeter’s capabilities might be an overkill.kill.
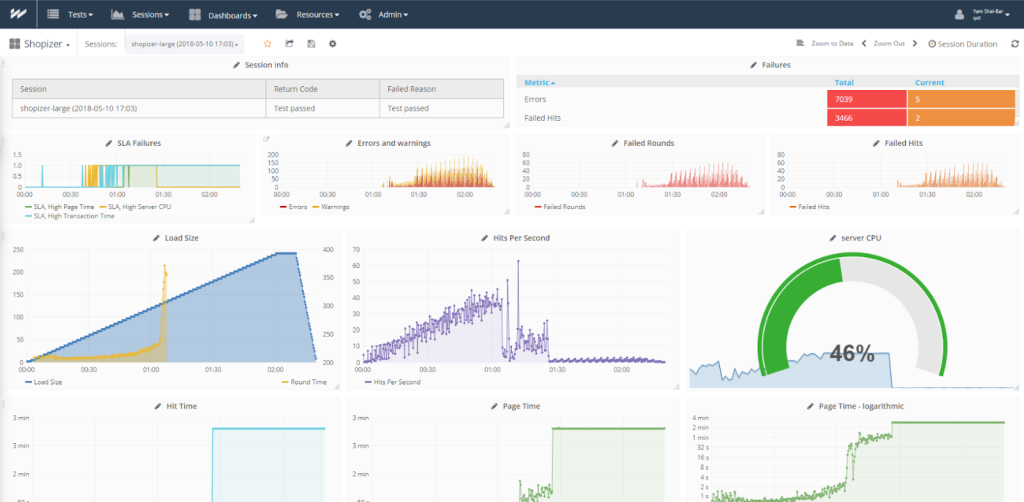
WebLOAD

Site: https://www.radview.com/webload/
WebLOAD is a professional platform for load testing web and mobile applications, primarily utilized in enterprise environments. Unlike lightweight tools like GTmetrix or Pingdom, WebLOAD is designed to simulate large volumes of users and analyze how the system performs under heavy loads.
The standout feature of WebLOAD is its ability to model complex user interaction scenarios. For instance, you can simulate the operations of an online store, with thousands of customers simultaneously visiting the site, searching for products, adding items to their carts, and placing orders. This approach helps identify bottlenecks, such as slow database responses or server overloads when processing transactions.
WebLOAD supports a range of functions, including:
- Simulation of thousands to tens of thousands of users simultaneously
- Multiple protocol support, including HTTP/S, SOAP, REST, WebSockets, and more
- Monitoring of server resources: CPU, memory, database, and network
- Flexible scenario customization: Utilizing JavaScript scripting
Test results in WebLOAD provide insights not only into response times and error rates but also into how the load impacts the entire infrastructure. For example, you can identify the exact point at which the server begins to struggle and pinpoint where failures occur.
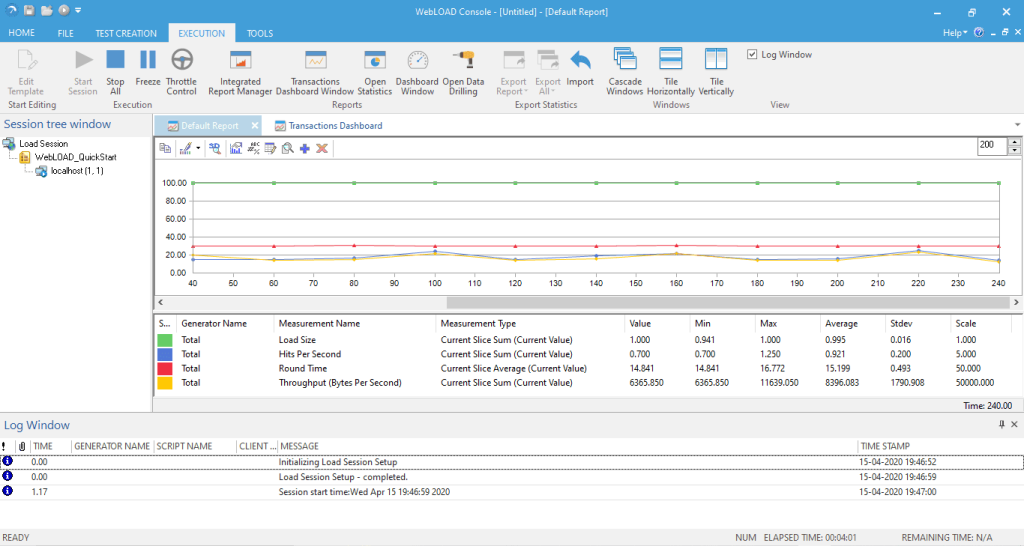
Another advantage of WebLOAD is its integration options and reporting features. The platform supports integration with CI/CD pipelines, allows for the creation of visual graphs and reports, and automatically notifies the team about any issues. This makes it a convenient tool for DevOps and QA teams.
However, the downside is that WebLOAD is a commercial solution. It is primarily aimed at medium and large businesses, so its licensing costs may be prohibitive for small companies. Additionally, the tool requires a certain level of training; beginners without load-testing experience may find the setup challenging to navigate.ve for small companies. Additionally, the tool requires a certain level of training; beginners without load-testing experience may find the setup challenging to navigate.
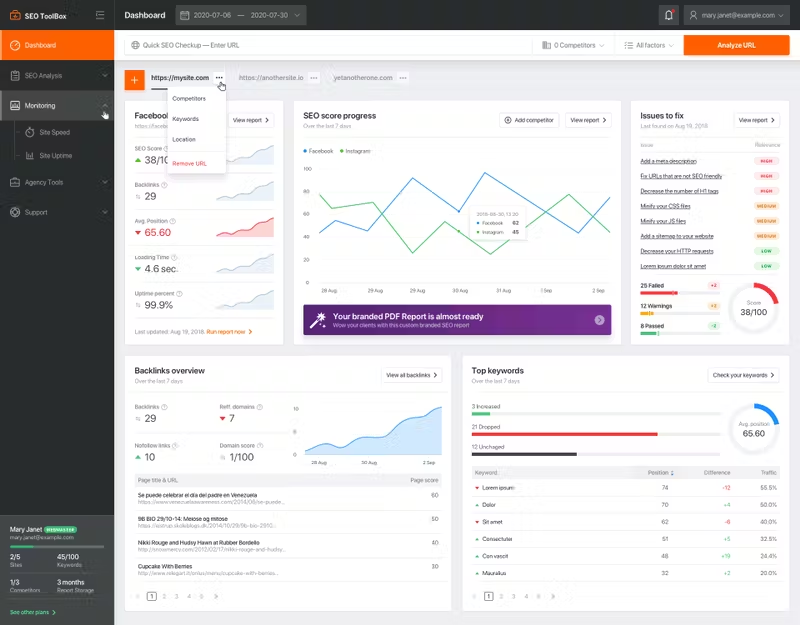
SEO Site Checkup

Site: https://seositecheckup.com/
SEO Site Checkup is an online tool that combines website speed testing with an analysis of its technical setup and SEO factors. Unlike more specialized services like GTmetrix or Pingdom, it provides a broader perspective, evaluating not only load time but also how well the site is optimized for search engines and user experience.
The main feature of SEO Site Checkup is its comprehensive audit. After entering the URL, users receive a detailed report divided into several categories:
- Speed and performance: Response time, Core Web Vitals, image optimization, and the use of caching and gzip compression.
- Mobile optimization: Assessment of responsive design and usability on smartphones.
- SEO indicators: Accuracy of meta tags, robots.txt, XML sitemaps, and SSL presence.
- Security: Availability of HTTPS and identification of mixed content vulnerabilities.
This is convenient for website owners. Instead of relying on multiple tools (one for speed, another for SEO, and yet another for security) everything can be obtained in a single report.
A distinct advantage of the tool is the overall score (ranging from 0 to 100), which provides an immediate understanding of the site’s condition. Each comment is accompanied by practical recommendations, such as “Enable gzip compression,” “Reduce image sizes,” and “Add a meta description tag.” These tips are designed not only for developers but also for business owners who can delegate tasks to a contractor or team.
The tool operates on a freemium model. A basic audit is available for free, but a subscription is required for regular monitoring and advanced analytics. This makes it especially appealing for small and medium-sized businesses that need a clear overview without delving into technical details.mall and medium-sized businesses that need a clear overview without delving into technical details.
Treo Site Speed

Site: https://treo.sh/
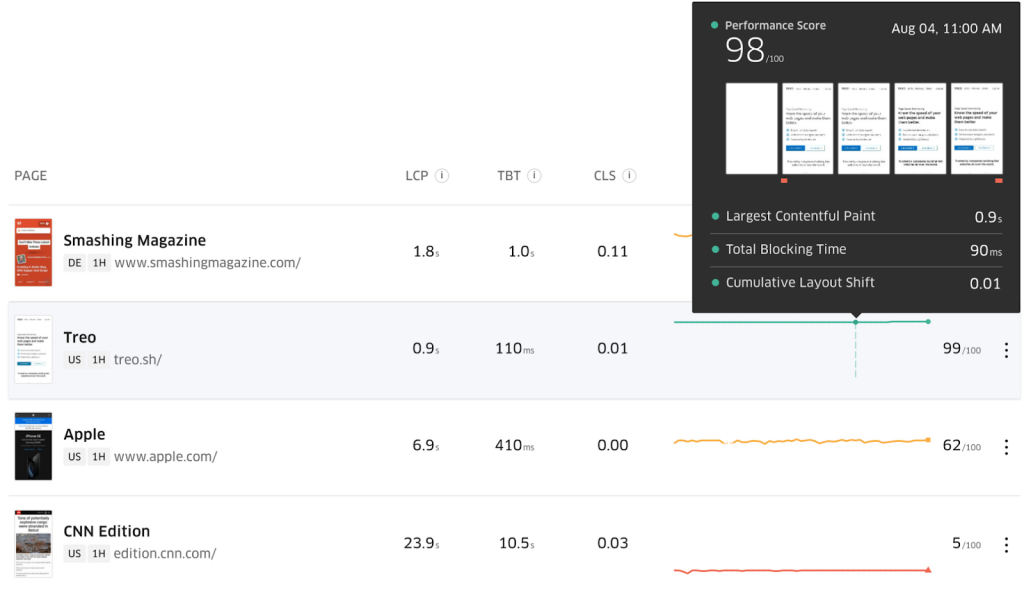
Treo Site Speed is a modern tool for analyzing website performance, distinguished by its focus on Core Web Vitals and real-user data. While many classic services like Pingdom or GTmetrix emphasize lab tests, Treo also utilizes statistics from the Chrome User Experience Report (CrUX) to demonstrate how the site performs for actual users.
The main feature of Treo Site Speed is the visualization of Core Web Vitals. The service clearly displays metrics such as LCP (Largest Contentful Paint), INP (Interaction to Next Paint), and CLS (Cumulative Layout Shift), along with additional metrics like TTFB (Time to First Byte) and FCP (First Contentful Paint). All results are conveniently presented in graphs, broken down by mobile and desktop.
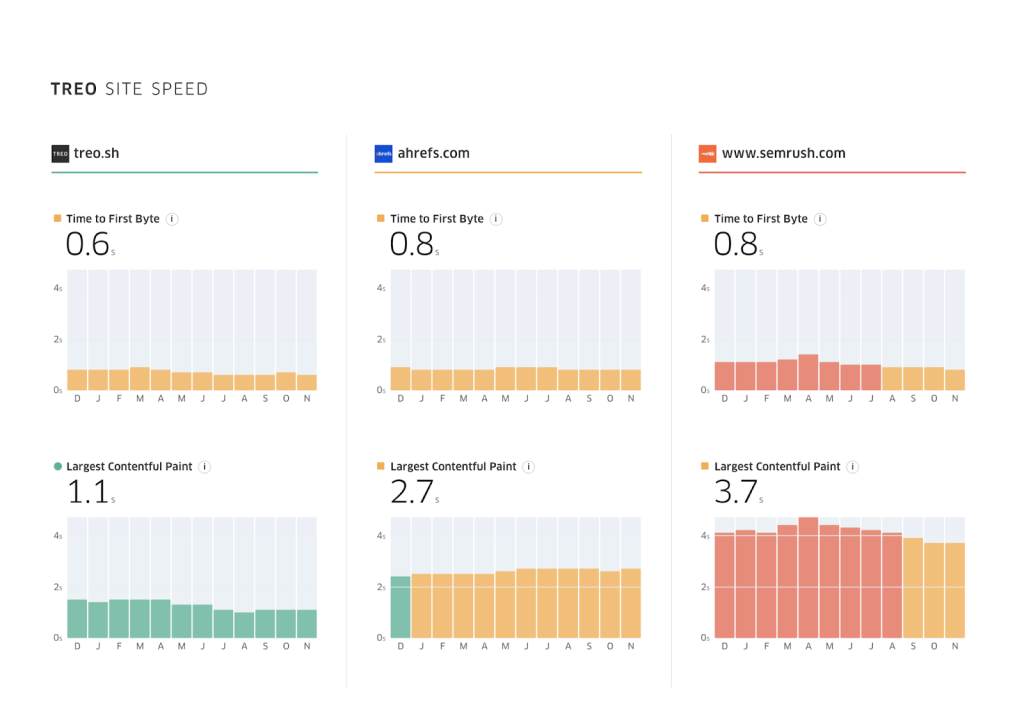
The tool also allows you to:
- Compare your site’s performance with competitors.
- Track monthly speed trends, which is especially useful for SEO analysis.
- See how users are distributed across the “green,” “yellow,” and “red” Core Web Vitals zones.
This analysis helps you understand, for example, that “70% of my mobile users have a good LCP, but 30% experience long load times due to weak devices or poor connections.” Such insights assist in setting optimization priorities.
Treo Site Speed is positioned as a tool for marketers and SEO specialists who focus on understanding how real users perceive the site and how this affects search rankings, rather than on technical code analysis.
Another plus is its simplicity. Unlike WebPageTest, which has numerous parameters, Treo provides a clean, concise report without overwhelming users with unnecessary data, making it accessible even for beginners.
The downside is that Treo is more focused on analyzing Core Web Vitals in an SEO context. It is not suitable for deep technical debugging, such as identifying specific heavy scripts. It’s best used alongside tools like Lighthouse or GTmetrix.vy scripts. It’s best used alongside tools like Lighthouse or GTmetrix.
Geekflare Website Audit

Site: https://geekflare.com/tools/website-audit
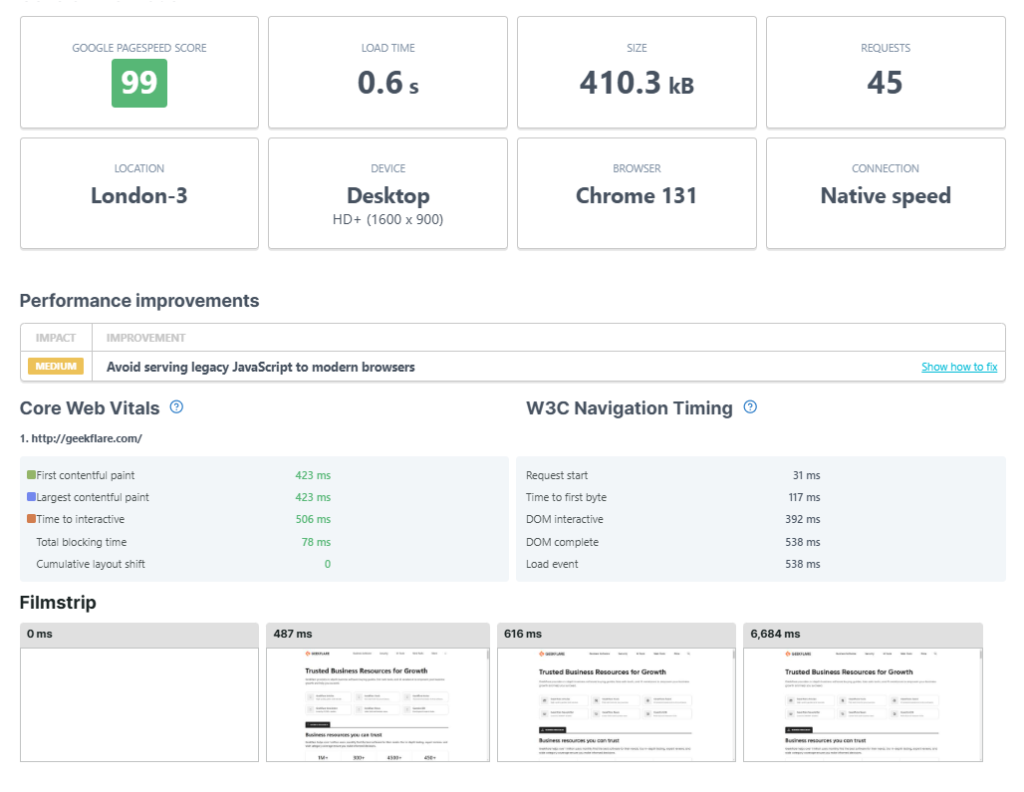
Geekflare Website Audit is a modern online tool that combines website speed testing, technical audits, and security analysis. Unlike narrower solutions, Geekflare provides website owners with a comprehensive view of their site’s overall health.
The primary feature of Geekflare is its extensive range of checks. In addition to standard speed metrics such as LCP, FCP, TTFB, and CLS, the service analyzes:
- Support for modern protocols (HTTP/2, HTTP/3, TLS)
- Accuracy of security settings (Google Safe Browsing, protection from mixed content)
- Image optimization and support for modern formats (WebP, AVIF)
- CDN operation and content geo-distribution
- Mobile-friendliness of the website
The Geekflare report is presented in a user-friendly format, with each category accompanied by a score and practical recommendations. For example:
- “Your site does not support HTTP/3. Enable it for faster data transfer.”
- “Images are too large. Consider compression or using the WebP format.”
- “Server response time is above average. Consider optimizing hosting or caching.”
Geekflare also places a strong emphasis on security. In addition to checking HTTPS, the tool can detect issues with SSL certificates, HSTS settings, and weak cryptography. This makes it valuable not only for developers but also for companies that prioritize user data protection.
The tool supports API access, allowing integration into workflows and enabling automatic audits as part of CI/CD processes. This is especially convenient for agencies and teams, as it allows for regular audits of client projects and tracking performance over time.
The downside of Geekflare is that the free version is limited in the number of scans, and full analytics are only available through a paid subscription. However, given the breadth of checks and the user-friendly interface, the tool is well-suited for developers, SEO specialists, and DevOps teams who value comprehensive control.nd DevOps teams who value comprehensive control.
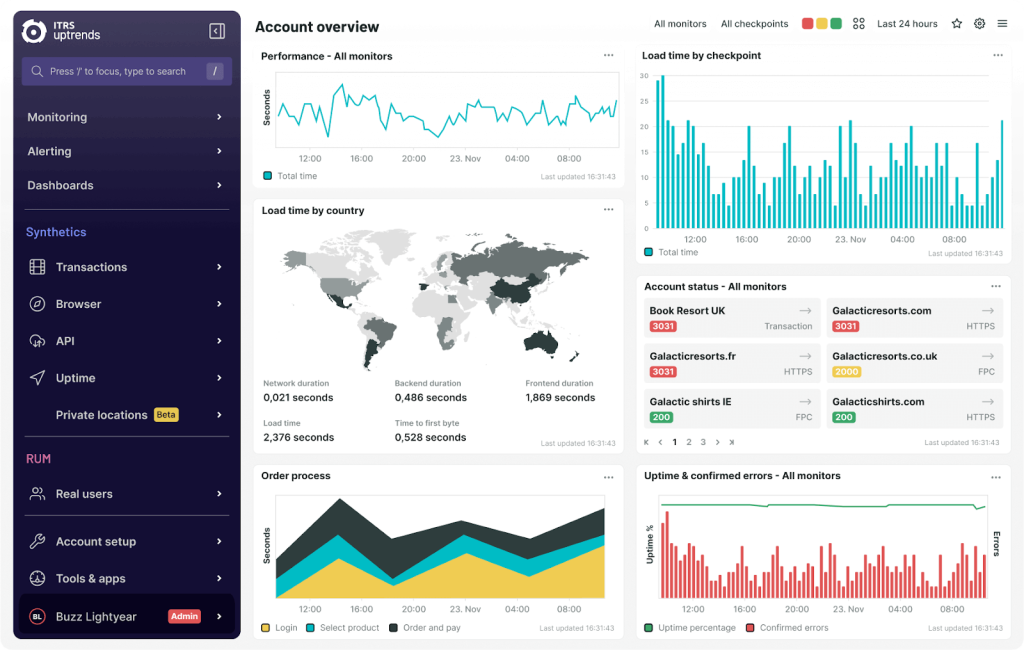
Uptrends Website Speed Test

Site: https://www.uptrends.com/tools/website-speed-test
Uptrends Website Speed Test is a convenient online tool for checking website speed, known for its flexibility and practical focus. A standout feature is the ability to test a website from servers located in different countries and across various continents. This allows you to assess how the resource performs for users in the USA, Europe, or Asia, and identify geographical differences in performance.
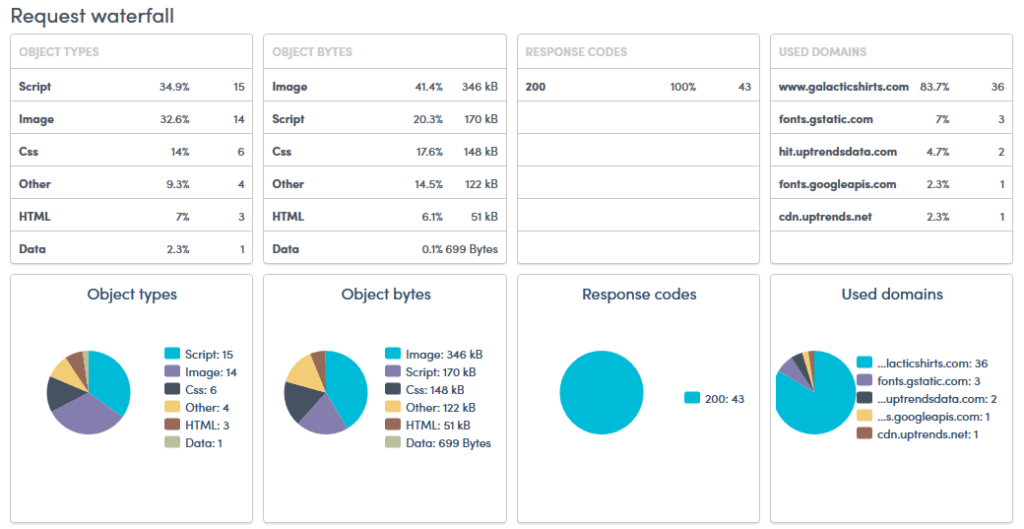
The tool shows:
- server response time (DNS, TCP, SSL);
- loading times for all resources (images, scripts, stylesheets);
- total page size;
- a waterfall diagram that shows which elements load faster and which slow down the site.
It is also worth mentioning the convenient mobile testing mode. Uptrends allows you to simulate website loading on smartphones with different connection speeds (such as 3G or 4G), which helps evaluate the real experience of mobile users.
The tool is focused on clear and practical reports. Even a beginner can easily identify bottlenecks — whether it’s oversized images, a slow server, or third-party scripts. The paid version also includes continuous monitoring functions (uptime), which enable you to receive real-time notifications about problems. The downside is that the free version is limited in the choice of locations and the depth of analysis. However, Uptrends is great for basic tests, and its paid version serves as a full-fledged service for monitoring the availability and performance of a site.
Fast hosting is an investment in the future of your website. Avoid chasing the lowest price. Remember, a slow website will end up costing you much more in the long run. Conduct tests, compare multiple providers, and review their specs as well as customer feedback.
And if you’re looking for a fantastic WordPress-optimized hosting that prioritizes speed, security, and convenience, you can’t go wrong with SpaceLama – a phenomenal WordPress hosting service.